

Monitor Itential overview
This guide covers the monitoring and observability stack for Itential Platform and Itential Gateway: what each tool does and how the pieces fit together. No prior monitoring experience is assumed.
The tools described in this guide are the stack that Itential uses and recommends. They were chosen for their open-source availability, broad adoption, and the fact that they work well together out of the box. Not every deployment needs this exact combination. The conceptual model matters more than the specific tools: Platform components produce metrics and logs, agents collect and forward that data, a storage backend retains it, and a visualization layer surfaces it with alerting on thresholds. Any tooling that fits that pattern is a viable alternative. See Tool alternatives for guidance on substitutions.
Why monitor Itential
Platform runs network orchestration workflows that touch real devices. When a workflow fails or a Platform component becomes unhealthy, you’re the one who has to notice, figure out what went wrong, and fix it, before a delayed change ticket turns into network devices left in a partially configured state. Monitoring is how you catch problems before they become outages, cut the time it takes you to diagnose a failure once one occurs, and build a historical record you can check against when you’re troubleshooting.
As you monitor Platform, you’re answering two complementary questions:
- Is Platform healthy right now? - Metrics answer this for you with numbers sampled continuously. For example, monitor CPU usage, memory consumption, queue depth, and replication lag.
- What happened during a specific event? - Logs answer this for you with a detailed, time-ordered record of every action Platform took.
You need both signals. Metrics tell you something is wrong, logs tell you why.
The two observability signals
Metrics
A metric is a number that’s measured repeatedly over time. Examples include the percentage of CPU currently in use, the number of active MongoDB connections, or the number of Platform jobs currently in a running state. Metrics are small, cheap to store, and well suited for dashboards and alerts. Prometheus collects metrics in the Itential stack. Grafana displays them.
Logs
A log is a timestamped record of something that happened, such as a connection attempt, an authentication failure, or a workflow step completing. Logs contain much more detail than metrics but are also much larger and more expensive to search at scale. The Itential stack supports two log management approaches:
- Loki with Alloy for a lightweight, Grafana-native solution.
- The Elastic Stack, which combines Elasticsearch, Logstash, and Kibana, for environments that need full-text search, audit trails, or compliance reporting.
See Manage logs for how to set up each option.
Metrics collection and visualization
Prometheus
Prometheus is an open-source monitoring system and time-series database. It’s the foundation of the Itential metrics stack.
How it works
Prometheus uses a pull-based collection model. Rather than having each monitored component push data to a central server, Prometheus reaches out to each component on a regular schedule and fetches the latest metrics. The default scrape interval for Itential deployments is 15 to 30 seconds. Each component exposes a plain-text HTTP endpoint at the path /metrics that Prometheus reads on each scrape cycle.
Metrics are stored in Prometheus’s built-in time-series database, which retains historical data for configurable durations. This history is what makes it possible to ask questions like “was CPU elevated three hours before this incident?” or “has this queue been growing for the past week?”
Impact
Prometheus provides a single, consistent place to store and query numeric health data for every component in the Itential stack. Platform, Gateway, MongoDB, Redis, and the underlying Linux hosts all expose metrics in the same format. Prometheus collects them all, so a single query can correlate an Platform job failure with a MongoDB connection spike and a CPU elevation on the same host, in the same view.
Query language
Prometheus uses a query language called Prometheus Query Language (PromQL). PromQL expressions are the foundation of Grafana dashboards and alerting rules.
A basic example:
This expression calculates the rate of idle CPU time over the past five minutes. Grafana uses expressions like this to populate the panels in a dashboard. You don’t need to write PromQL to use Grafana dashboards, but understanding that each panel is driven by an expression helps when you read alert definitions or customize thresholds.
Grafana
Grafana is the visualization layer for the Itential metrics stack. It connects to Prometheus as a data source and displays the collected metrics as dashboards.
What it provides
- Pre-built dashboards for Platform, Gateway, MongoDB, and Redis that surface the most operationally relevant metrics without custom configuration.
- A flexible panel editor for teams that want to customize views or build dashboards for specific workflows.
- Alert rule management, so teams can define thresholds and notification policies directly in the Grafana UI.
- Support for multiple data sources simultaneously. A single Grafana dashboard can show Prometheus metrics alongside log data from Loki or Elasticsearch, making it possible to correlate a CPU spike with the log events that caused it.
Impact
Raw Prometheus data isn’t browsable without writing queries. Grafana turns that data into visual panels you can read at a glance. Dashboard panels for CPU, memory, disk, queue depth, and job counts give you a complete operational picture without any manual querying. When something looks wrong on a dashboard, Grafana’s links into the underlying log data let you drill down from a metric spike directly into the relevant log events.
Alerting
Alerting notifies the right people when a metric threshold is breached, without requiring anyone to actively watch a dashboard. It’s a required part of any production monitoring strategy for a network automation Platform, where a degraded component can affect real devices and active workflows.
How it works
Alerting rules define conditions and durations. A rule might state that CPU usage above 85% for five consecutive minutes should trigger a notification. When that condition is met, the alerting system routes a notification to the appropriate destination. Rules typically include the current value, the threshold that was breached, and a link to the relevant dashboard for faster triage.
Most alerting systems support grouping related notifications to avoid flooding on-call channels during a cascading failure, and silencing to suppress known events during planned maintenance windows.
Severity levels
Itential defines three standard severity levels for metric-based alerts:
Itential’s alerting configuration
Itential configures alerts directly in Grafana and routes notifications to a dedicated team Slack channel. Grafana’s native alerting supports a broad set of contact points, including Slack, PagerDuty, Opsgenie, email, Microsoft Teams, and webhooks, so you can deliver alert notifications in whatever form your team needs.
Integrating with your existing alerting tooling
Most organizations already have a standard alerting and on-call Platform in place. The monitoring stack should feed into that existing system rather than replace it. The goal is to make Platform health a first-class signal in the alerting workflow your team already responds to, not to introduce a parallel process. Whether that means routing Grafana alerts to PagerDuty, forwarding them to ServiceNow, or posting to a Slack channel, Grafana’s contact point configuration makes the integration straightforward.
Prometheus collects these metrics from a set of exporters deployed alongside each component. See Exporters for what each one collects and Itential’s standard alert thresholds.
Architecture overview
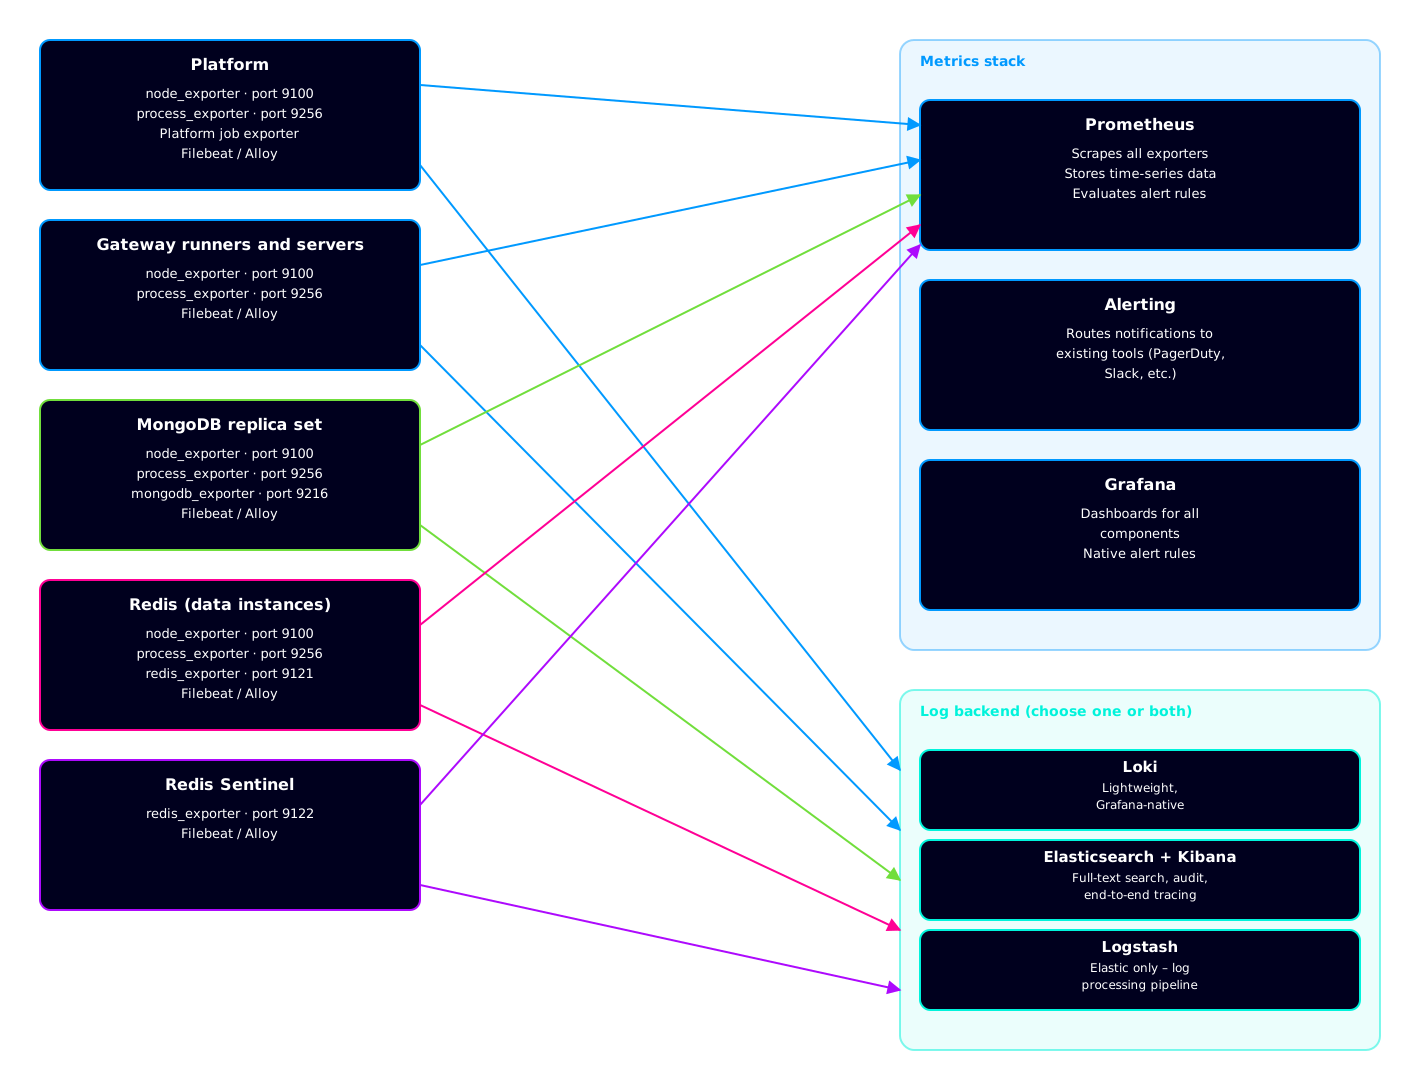
The following diagram shows how all components in the Itential monitoring stack connect to one another.
Data flows
- All exporters expose an HTTP
/metricsendpoint. Prometheus pulls from each endpoint on each scrape interval (15 to 30 seconds). - Prometheus evaluates alerting rules continuously. When a threshold is breached, notifications are routed to your existing alerting and on-call tooling.
- Grafana queries Prometheus, and optionally Loki or Elasticsearch, to render dashboards.
- Alloy (for Loki) or Filebeat (for Elastic) tail log files on each host and forward new log lines to the log backend. This includes all Platform, Gateway, MongoDB, Redis data instance, and Redis Sentinel hosts.
- Logstash (Elastic only) receives log events from Filebeat, normalizes them, and writes them to Elasticsearch.
Minimum versions
Itential validates this stack against the following minimum versions in its performance lab. Older versions may work, but Itential hasn’t tested them.
Tool alternatives
The tools described in this guide are Itential’s chosen implementation. They’re widely deployed, well documented, and freely available under open-source licenses, which makes them a practical default for most environments. If you have an existing monitoring investment, specific vendor requirements, or enterprise support constraints, you aren’t required to use them.
The key requirement for any alternative is compatibility with the data formats produced by the exporters. Metrics exporters produce output in Prometheus text format, which has become a de facto standard for infrastructure metrics. It’s supported natively by Prometheus and also by any tool that implements an OpenTelemetry Prometheus receiver. Log agents forward log streams in standard formats (JSON, plain text) over well-supported protocols such as HTTP and gRPC.
Metrics and visualization alternatives
Tools such as Zabbix, Datadog, Dynatrace, and Cisco ThousandEyes can serve as the metrics collection and visualization layer, provided they can scrape Prometheus-format endpoints or ingest OpenTelemetry metrics. The exporters themselves don’t need to change. The scrape configuration, alerting rules, and dashboards would need to be implemented in the chosen tool’s native format.
Log management alternatives
The Elastic Stack can be replaced with Splunk, which is common in enterprise environments that already have a Splunk deployment. Splunk can ingest the same structured log output from Platform and Gateway that Logstash processes in the Elastic model. The log collection agent (Filebeat or Alloy) may be replaced by a Splunk Universal Forwarder or another Splunk-compatible agent.
The conceptual flow doesn’t change
Regardless of the specific tools in use, the data flow follows the same pattern:

Understanding this flow is more durable than memorizing the names of specific tools. When you evaluate alternatives, ask:
- Can this tool scrape Prometheus-format metrics endpoints?
- Can it ingest structured log streams?
- Does it support threshold-based alerting with notification routing?
- If the answer is yes to all three, it’s a viable replacement for the corresponding layer in this stack.