Jobs and metrics
Every time you run a workflow in Itential Platform, the platform creates a corresponding job. A job is an instance of a workflow, along with its runtime data, that is in some state of execution on the platform: running, paused, canceled, or completed. Knowing how to manage jobs is essential to successful workflow execution, and Operations Manager serves as your job management hub.
This page covers:
- How to use the jobs table to monitor job status and perform job actions.
- How to use the Job Details view to see job properties, interact with tasks, and troubleshoot errors.
Understand jobs
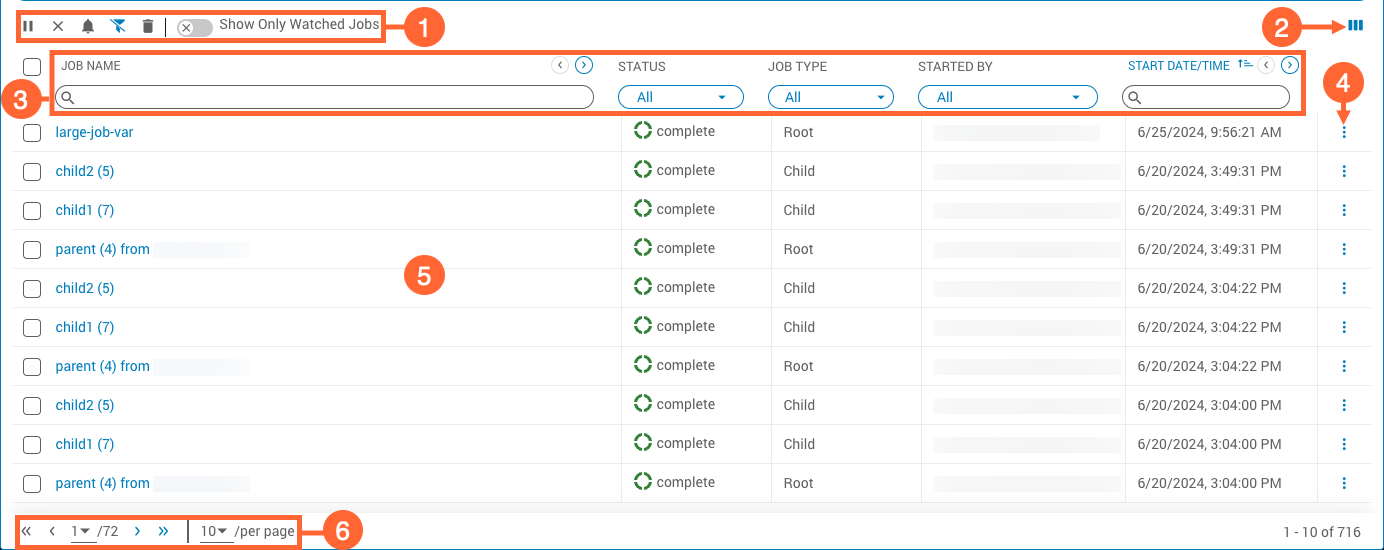
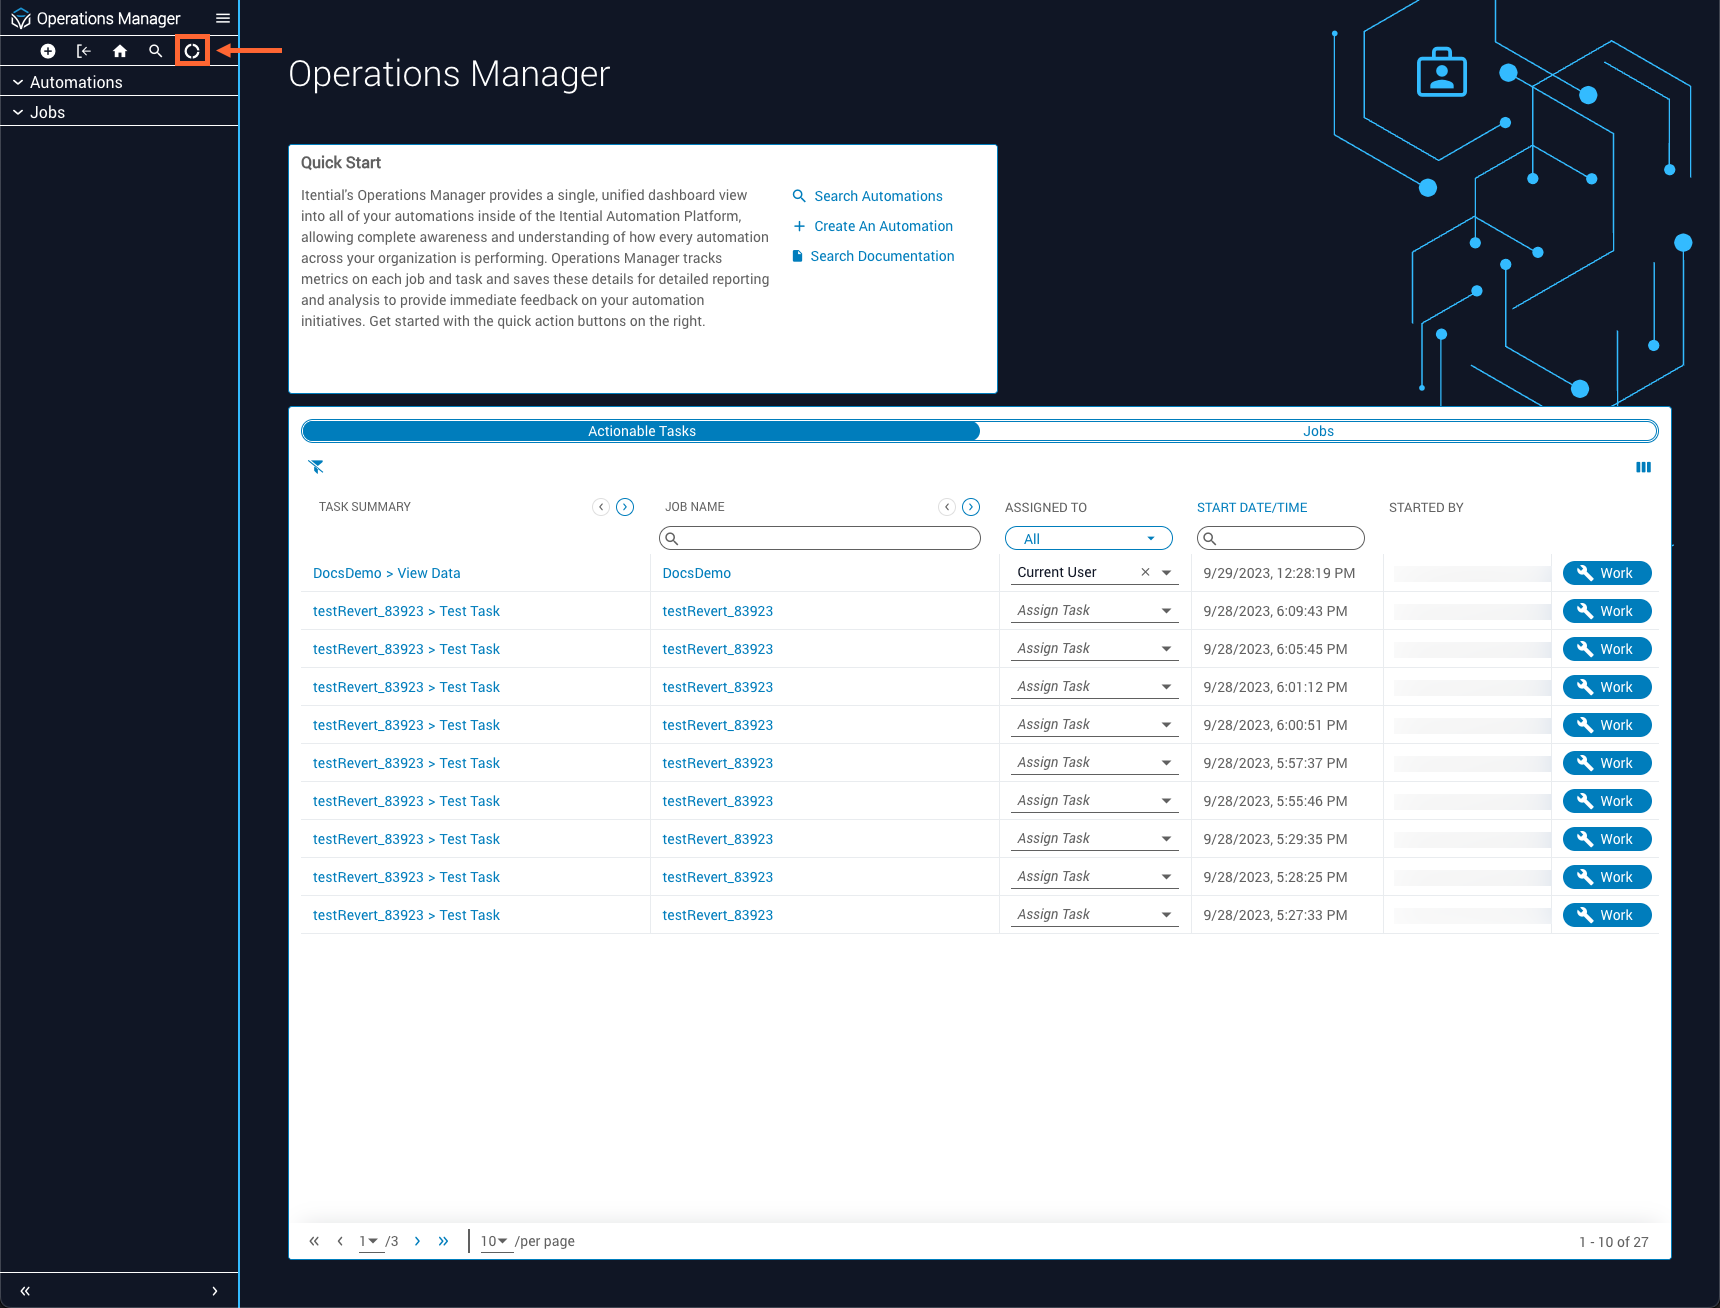
Operations Manager displays all available jobs in a table view. Use the jobs table to monitor job status and perform basic job management actions, such as pausing, watching, canceling, or deleting jobs. It is present in two locations:
- The Operations Manager dashboard.
- The jobs page, accessible from the side navigation menu.
Jobs page
Opening the Jobs page may pre-apply a filter to the Jobs table, depending on which link you select from the side navigation menu. For example, selecting All Jobs displays an unfiltered Jobs table, while selecting Errored Jobs lists only jobs in an error state.
Version differences
Job deletion was introduced in version 2023.1.18 of Itential Platform and is unavailable in earlier versions.
The Jobs table is comprised of the following elements:
Pausing jobs
Actively running tasks finish execution even if their containing job is paused. If an actively running task is the final task in a job, the job completes as normal after task execution. The main exception is the childJob task, which pauses execution in step with its containing job.
Delete jobs
Only completed or canceled jobs can be deleted.
Deleting parent jobs
Deleting a parent job also deletes all of its children. This is the only way that child jobs can be deleted.
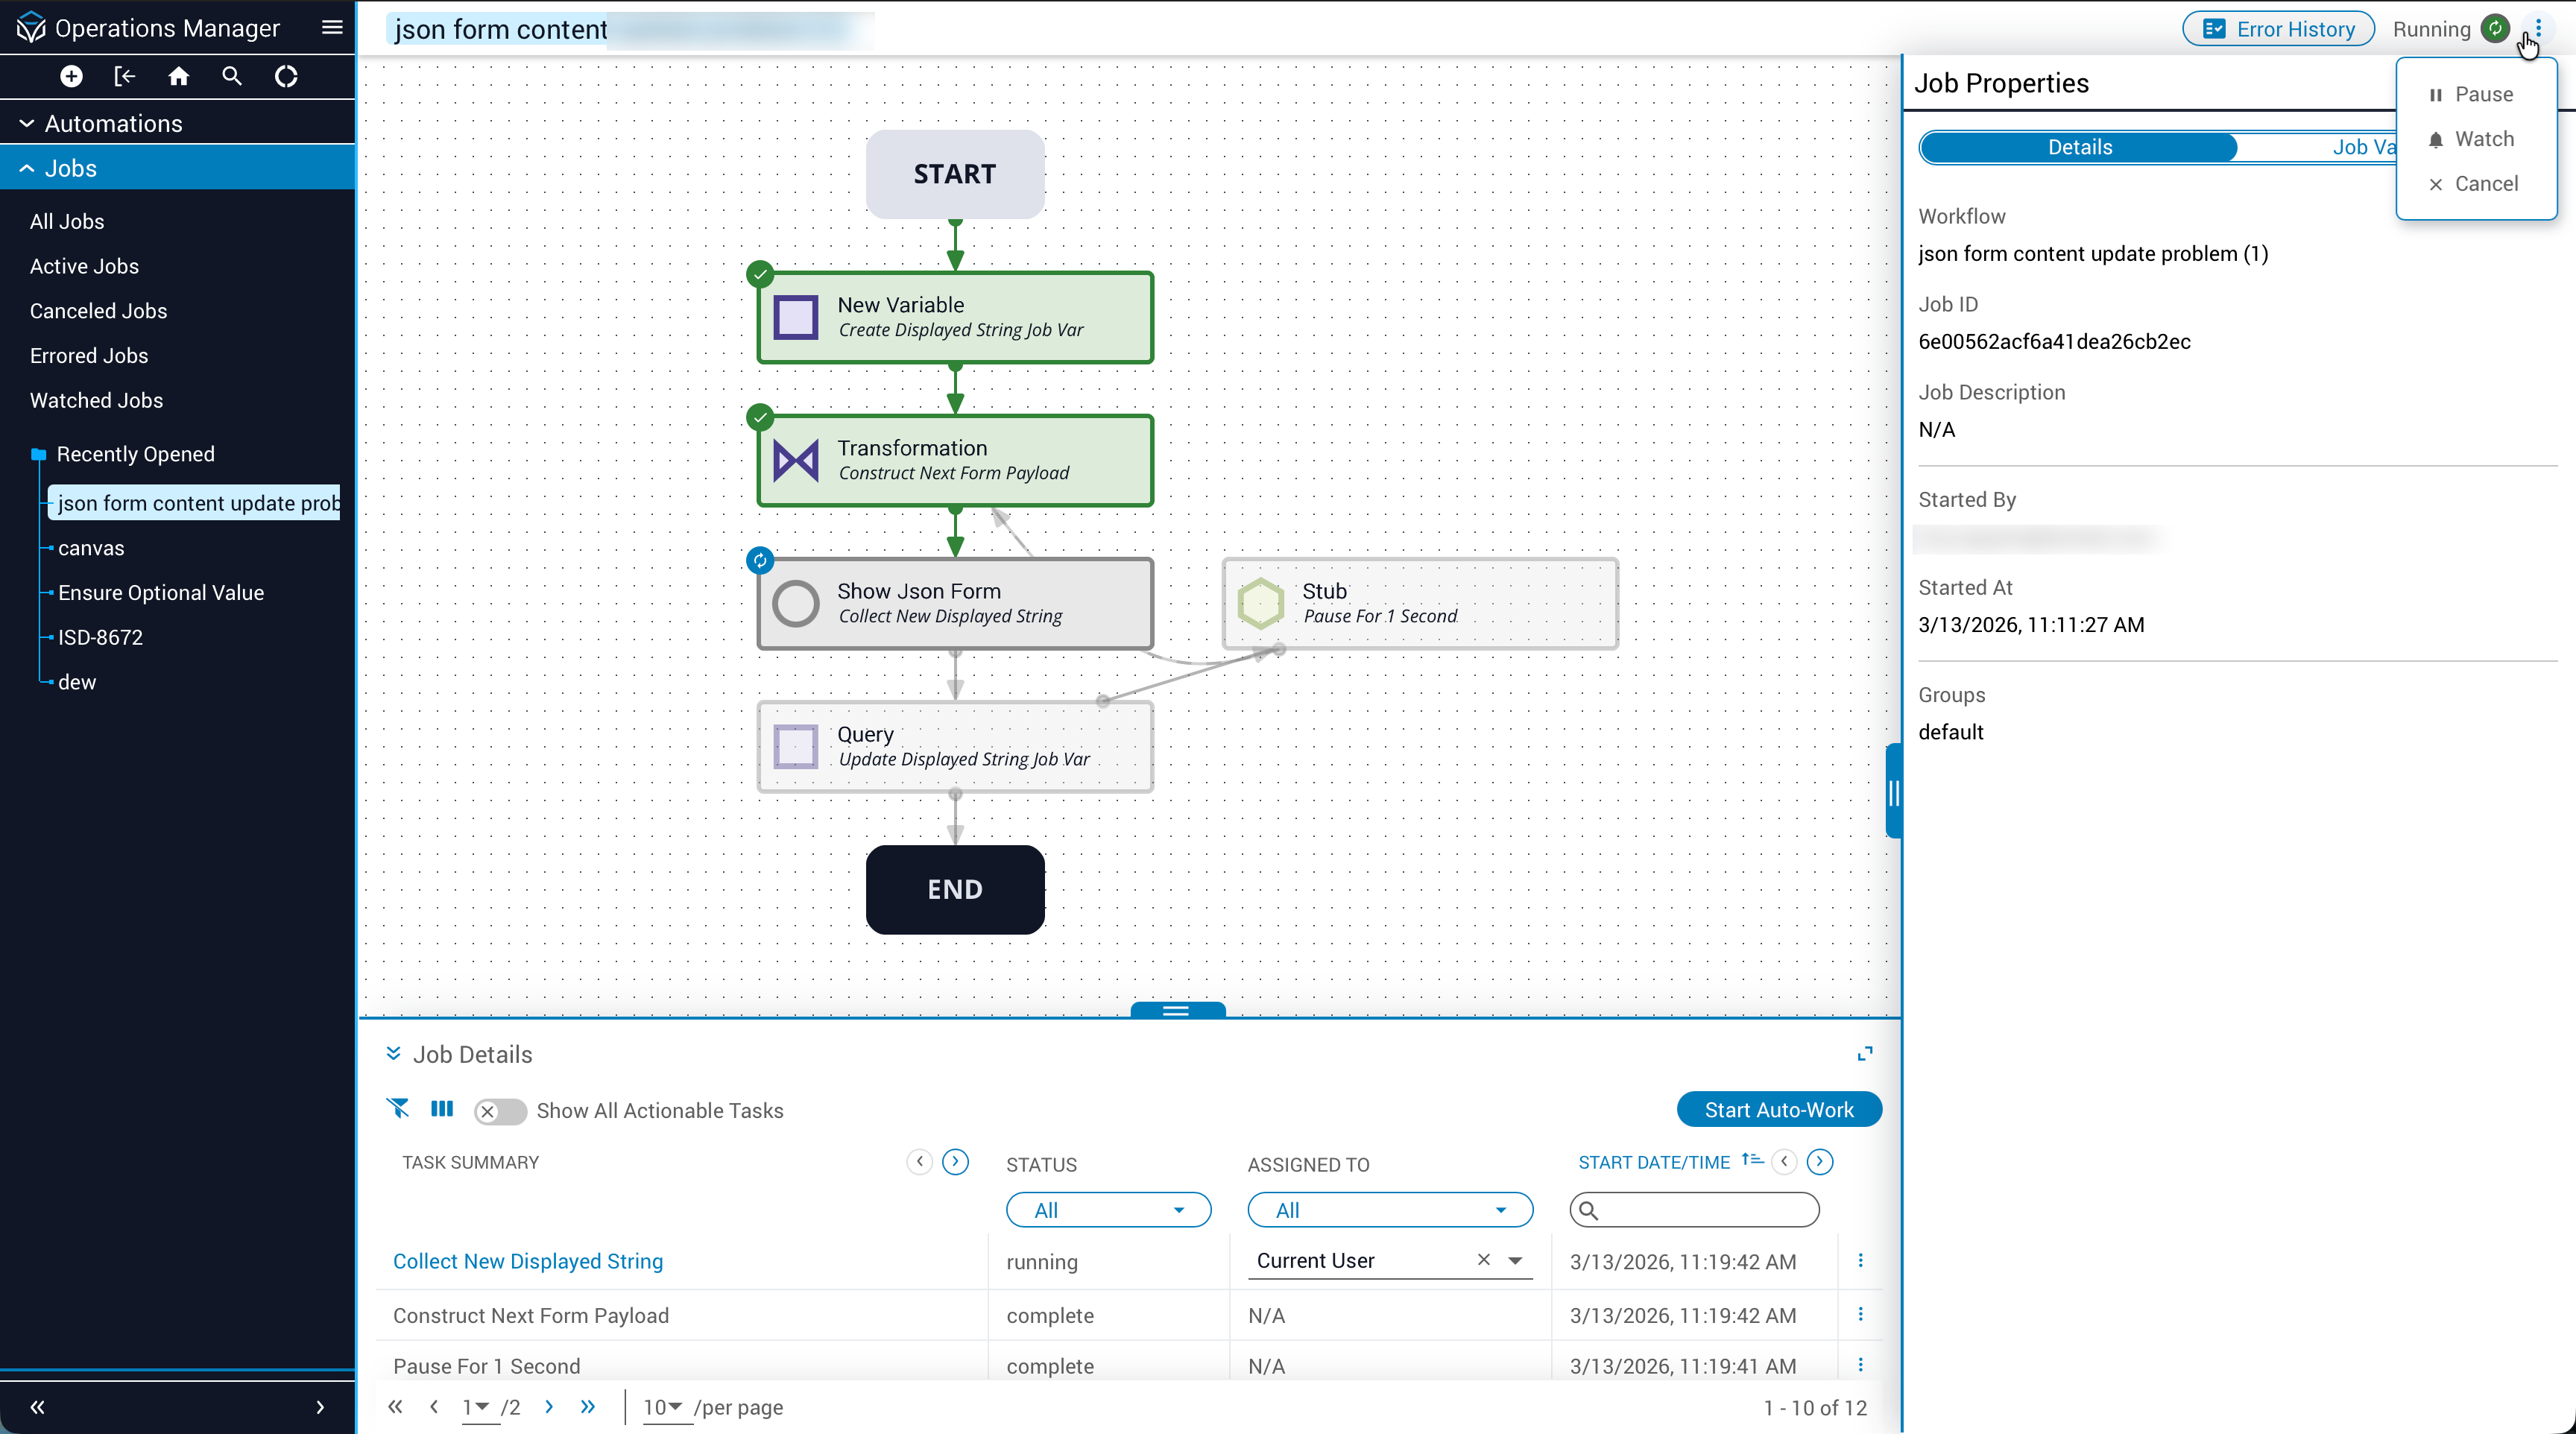
Job visualizations
The Jobs table is useful for checking job status at a glance and performing quick management actions, but it does not provide the in-depth tooling needed for more detailed job operations. In those situations, open a job’s visualization, also known as the Job Details view. This interactive diagram of your job allows you to perform advanced management actions such as viewing job properties, interacting with job tasks, and troubleshooting job errors.
Job visualizations are comprised of the following elements:
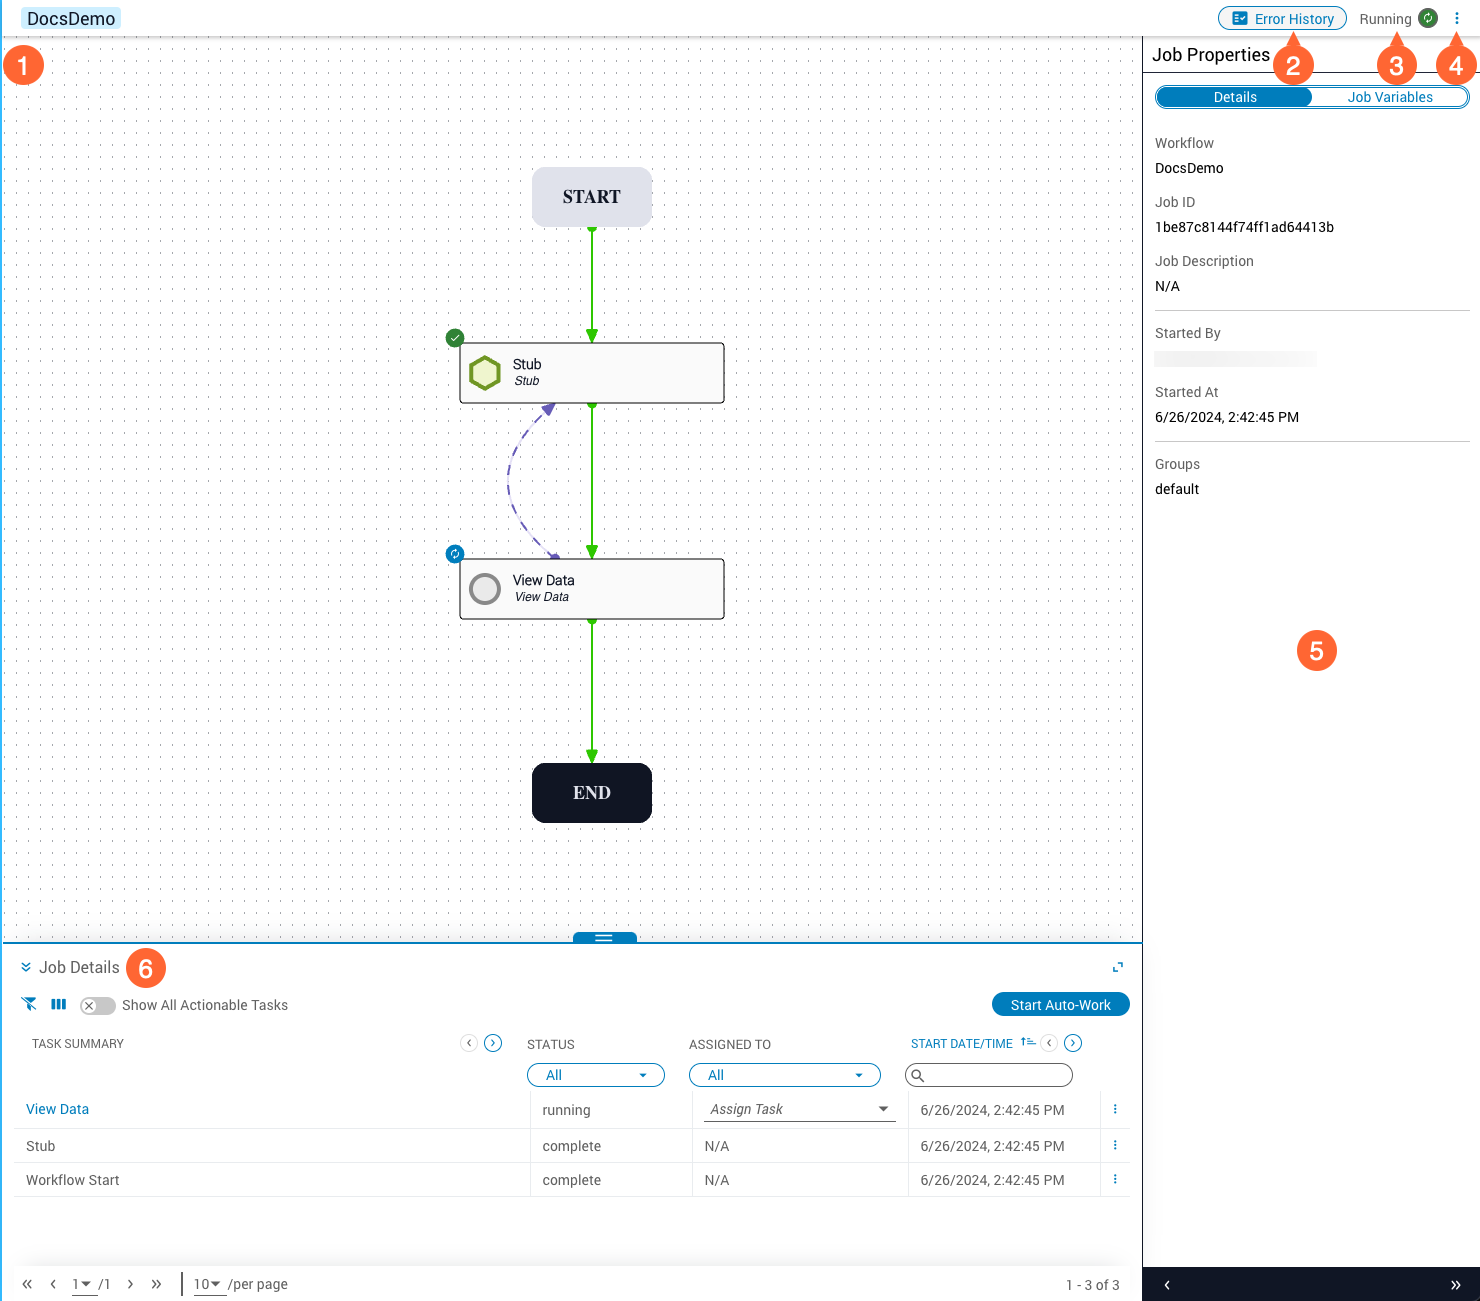
Job properties
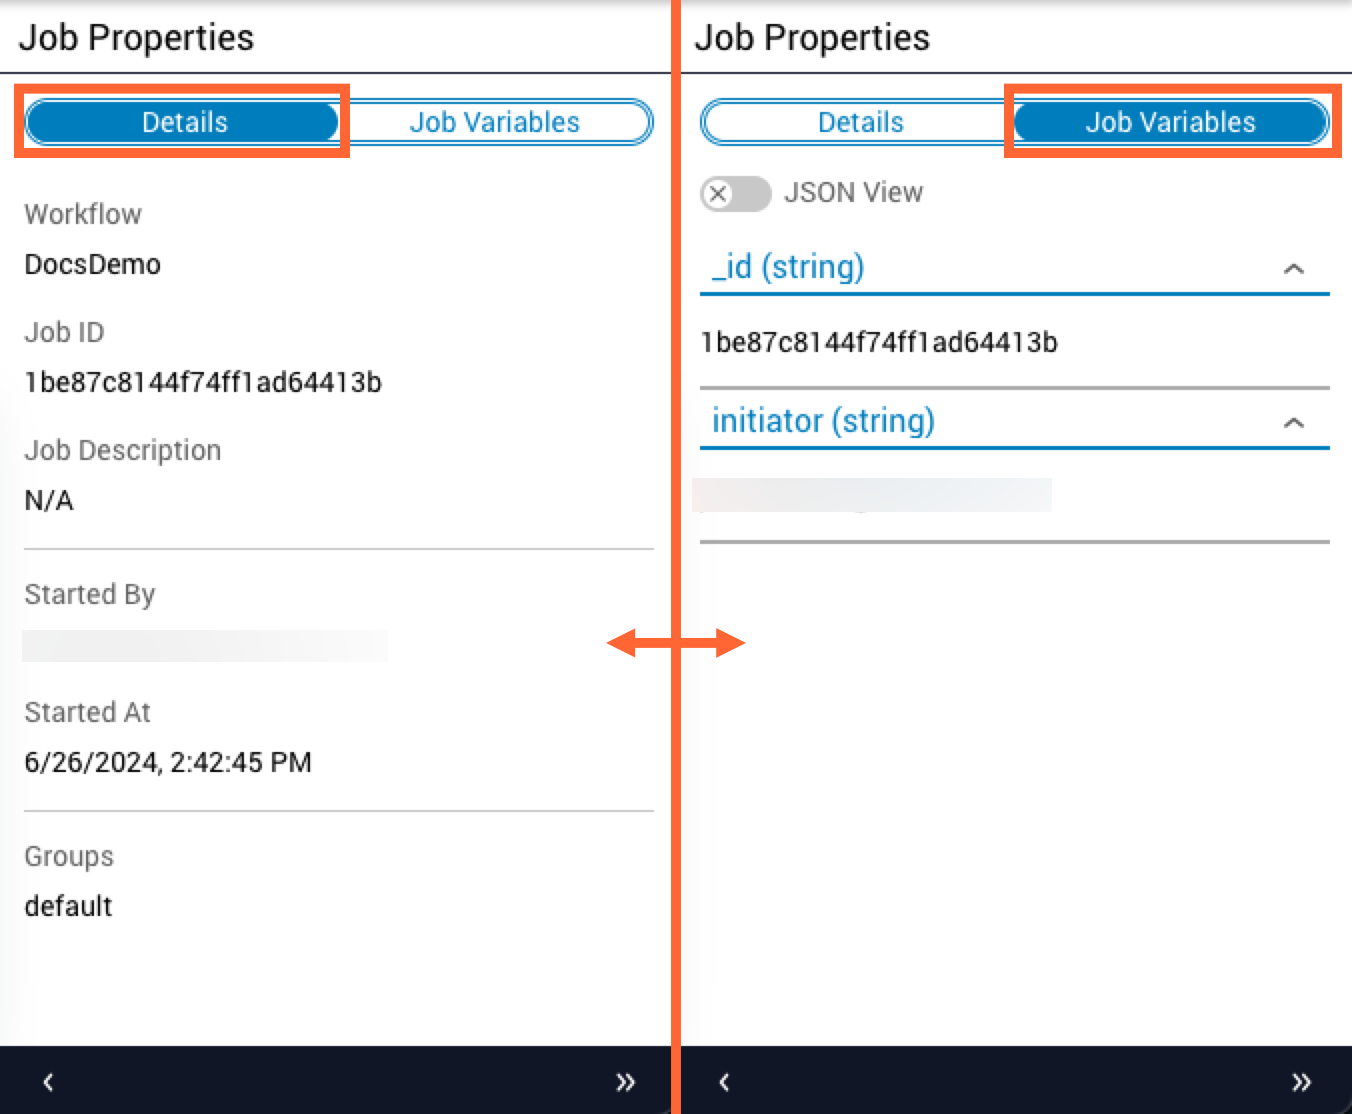
The Job Properties panel, on the right side of the Job Details view, displays runtime information about your job organized into two tabs:
- The Details tab displays a job’s details, such as its identifier, description, start date, and associated workflow.
- The Job Variables tab displays the runtime values of any job variables present.
Prior to version 2023.1 of Itential Platform, multiple types of workflows could be created in Studio. Because each workflow type has a unique feature set, the contents of the Job Properties panel can differ depending on which type of workflow is associated with the job.
Task interactions
The Task Properties panel provides information about the individual tasks that compose your job, in much the same way as the Job Properties panel does for the job as a whole.
Open the Task Properties panel
Locate the desired task in the Job Details table and click the View button at the end of the relevant table row. The Job Properties panel transforms into the Task Properties panel.
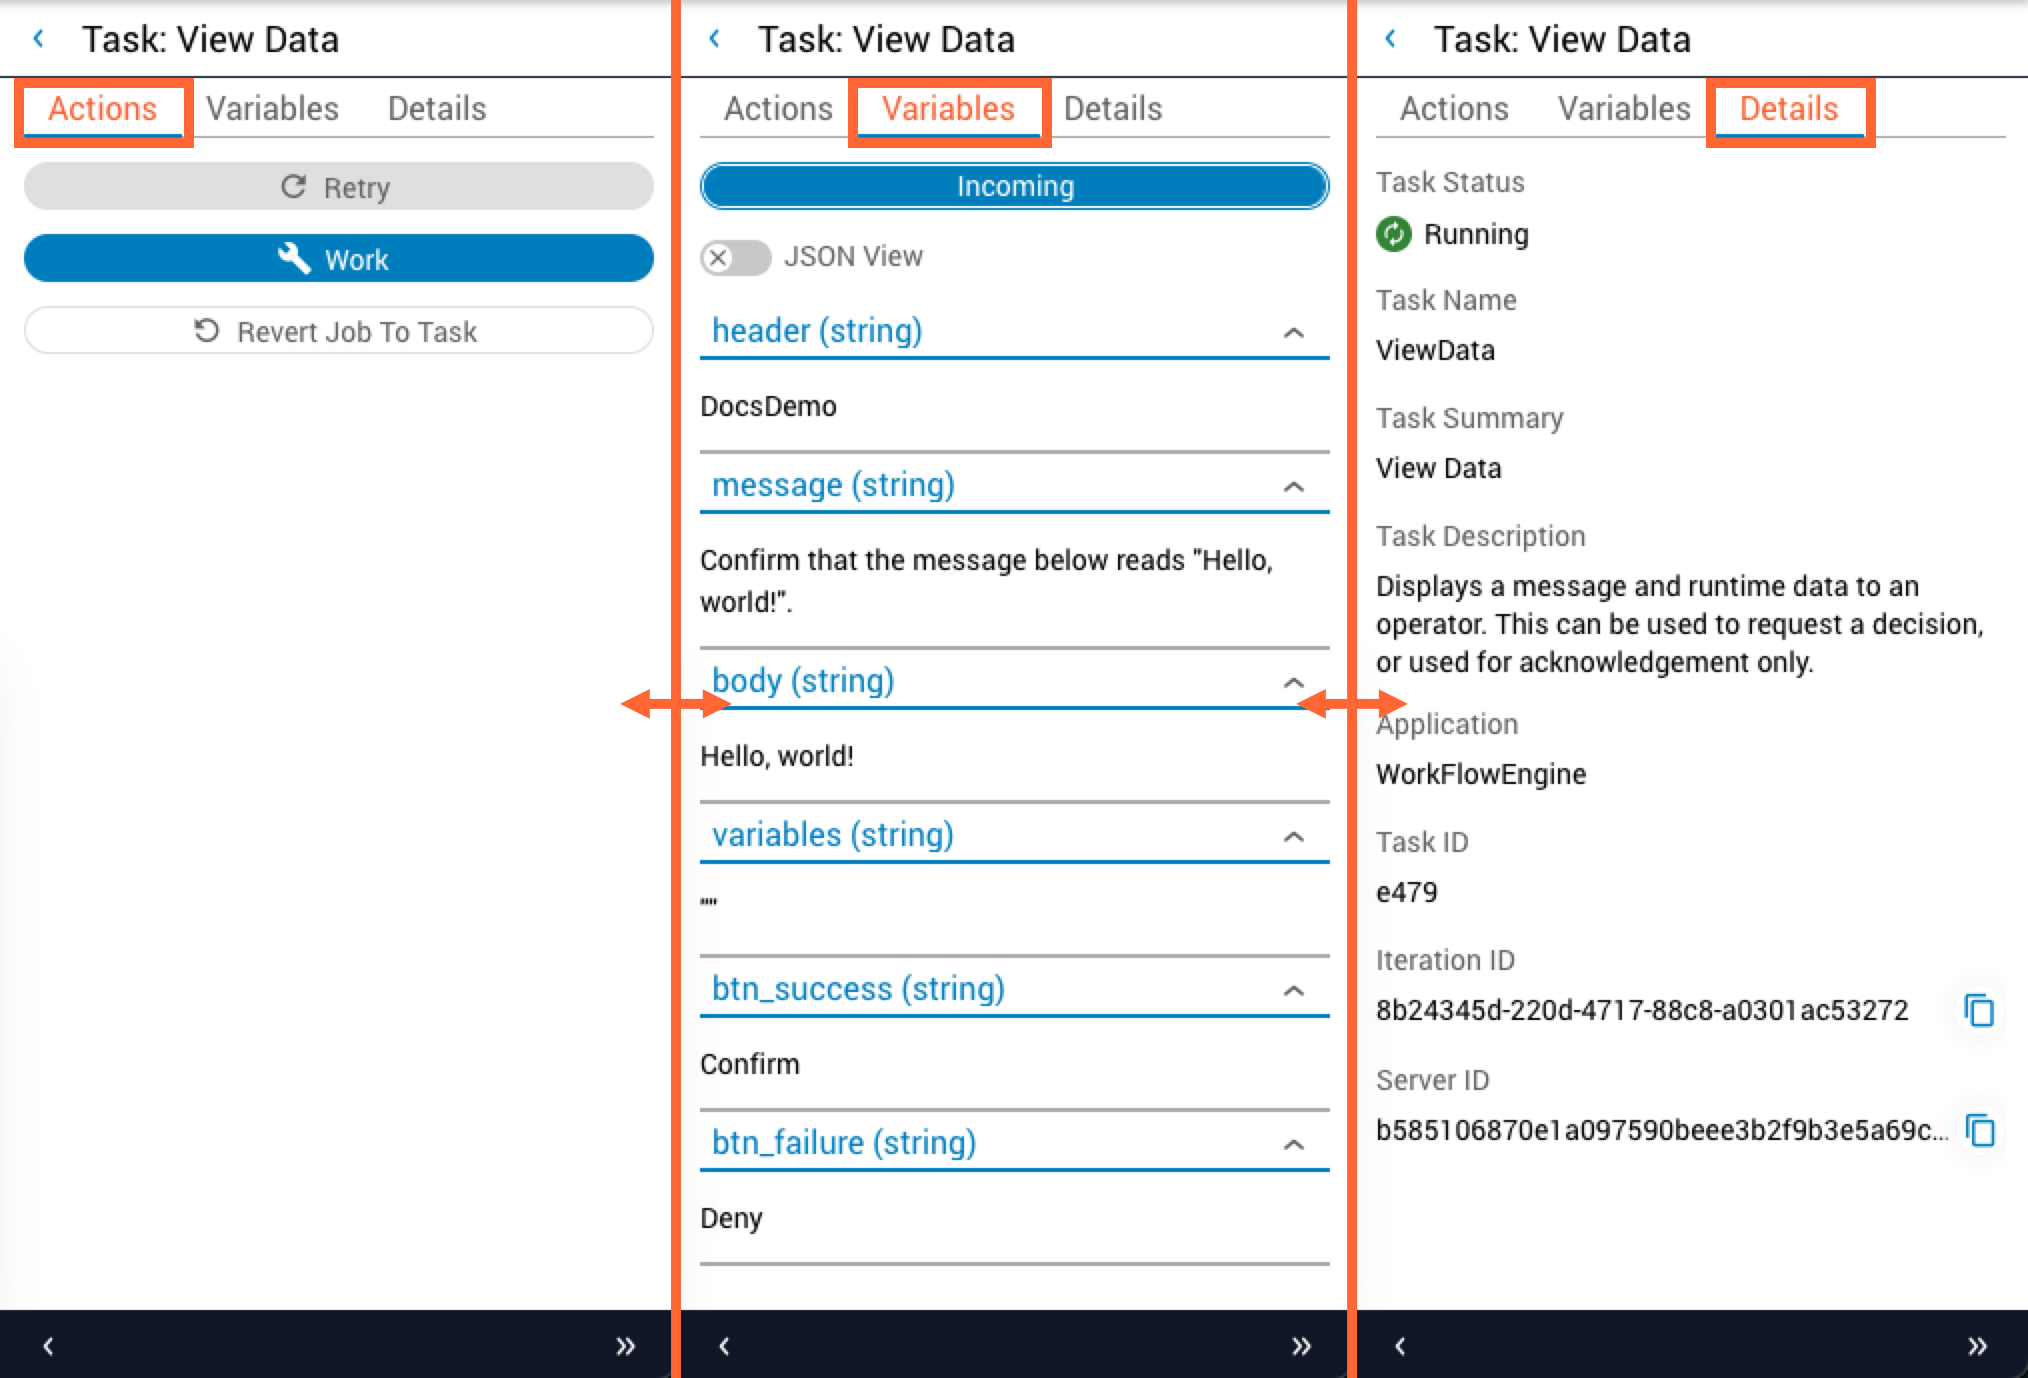
Review task information
The Task Properties panel organizes information into three tabs:
- Actions: actions that can be performed on the selected task, such as working or retrying it.
- Variables: job variables related to the selected task.
- Details: the task’s details, such as status, name, and description.
Click the desired tab to view its information.
View task query results
For any task input field configured with a query, the Task Details panel shows the resolved value by default. Click the Show source data icon on the input field to expand the source data overlay.
If the task input was sourced from a task variable, the overlay displays:
- The source task name
- The task variable the query was applied to
- The query
- The full source data payload, with expand capability
If the task input was sourced from a job variable, the overlay displays:
- The job variable
- The query
- The full source data payload, with expand capability
The source task name is displayed rather than its raw ID. The source task is also highlighted on the job canvas for easy identification. Double-click the task to navigate directly to its details in the Task Details panel.
When a query fails, for example because a key is missing, the query is displayed with red highlighting and an error label identifies the query as the cause.
For information about using queries in tasks, see task input query.
Null value distinction
The Task Details panel distinguishes between two types of null on a task-query-configured input field:
You can interact with any actionable tasks present in your job directly from the Job Details table:
Auto-Work
To interact with actionable tasks automatically as your job progresses, enable the Auto-Work feature by either:
- Clicking the Auto-Work button in the top-right corner of the Job Details panel.
- Appending
?autoWork=trueto the URL of a running job. This is useful for inserting links in automated communications such as emails and alerts.
Auto-Work executes until it exhausts all actionable tasks or you click Stop Auto-Work. It is disabled prematurely if you navigate away from the Job Details page, including by opening other jobs.
Revert tasks
While your job is in a paused or errored state, use the Revert button for any successfully completed task, accessible via its context menu or Task Properties panel, to re-run the job from that task forward. This lets you re-attempt a portion of job execution to fix task errors, such as incorrect manual task inputs or remote service timeouts, that might otherwise result in job failure.
View job errors
As your job executes, Operations Manager continuously monitors the status of its component tasks and records any errors that occur. These errors are cataloged in the Job Errors table, accessible by clicking the Error History button near the top-right corner of the Job Details view.
To copy information from the table to your clipboard, hover over the relevant table field and click the Copy to Clipboard icon that appears.
Task errors are also displayed in the Task Properties panel. In such cases, the Actions tab is replaced by the Error tab.
Job metrics
Job Metrics is a hub for analyzing time savings and performance statistics for automations. To access it from Operations Manager, click the Job Metrics icon in the icon bar at the top left.
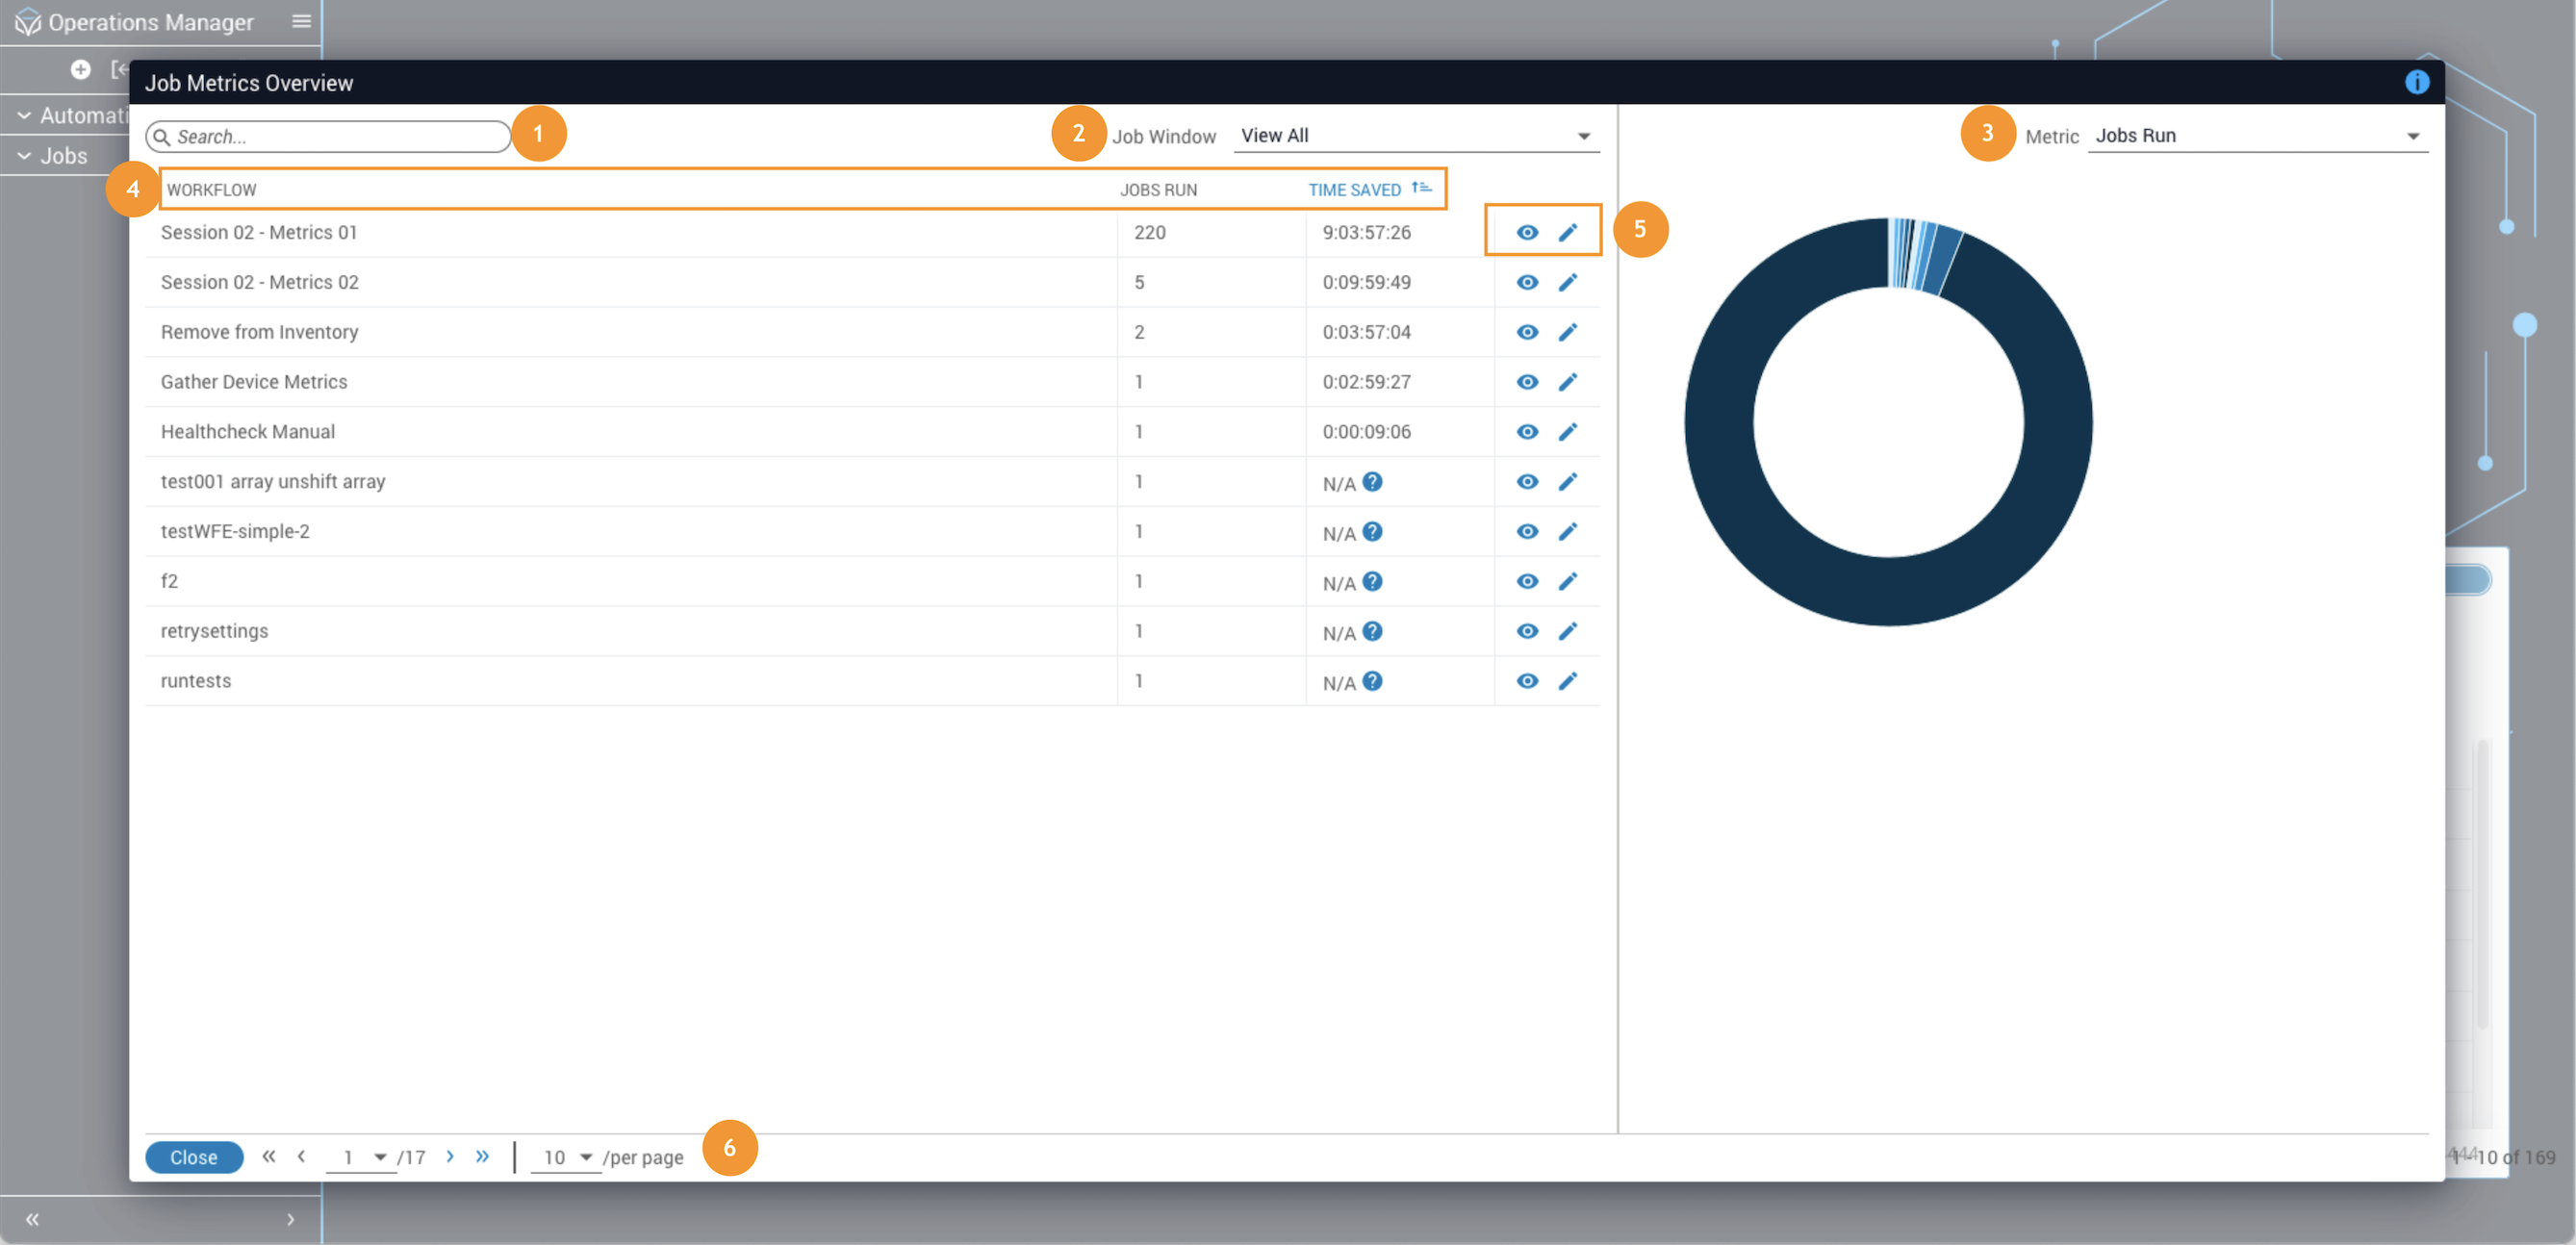
Job Metrics overview
Job Metrics Overview is the entry point into Job Metrics. From here you can browse previously run workflows and view basic metrics, open detailed metrics for each workflow, or open them in Studio.
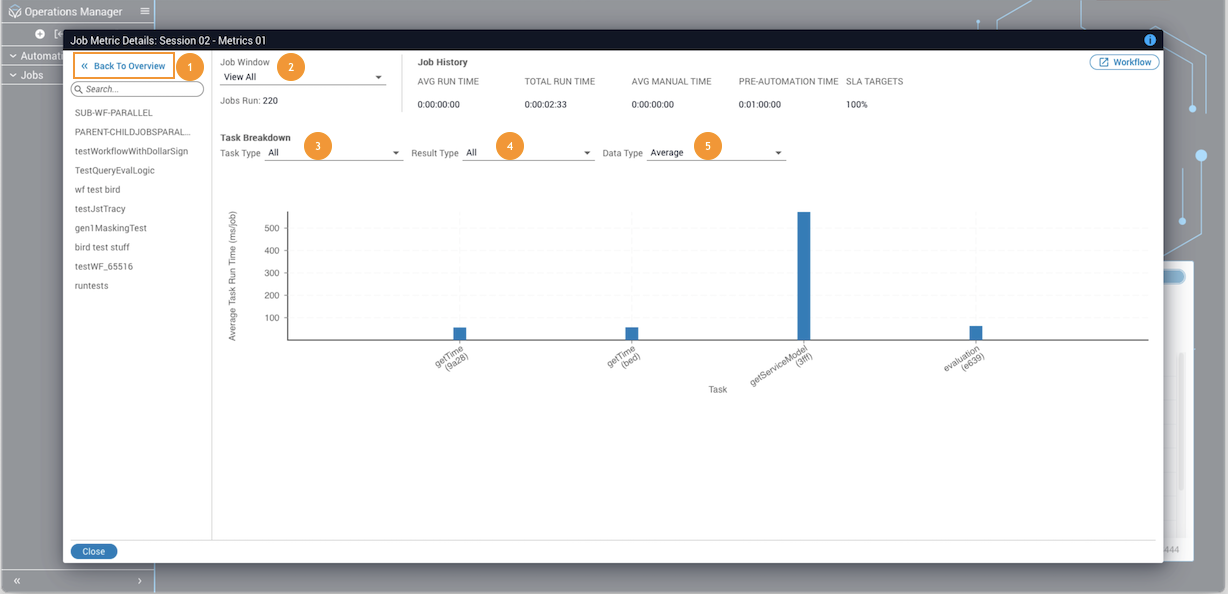
Job metric details
The Job Metric Details dialog shows detailed metrics data for an individual workflow, including specific time savings and performance metrics. You can also view performance data on individual tasks in the workflow.
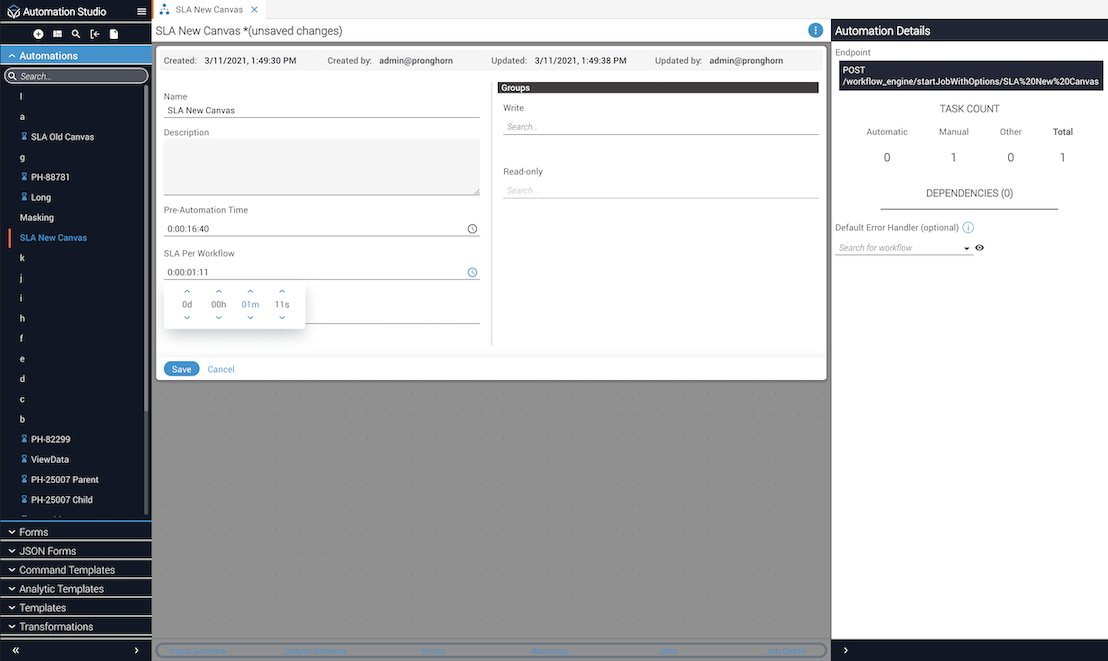
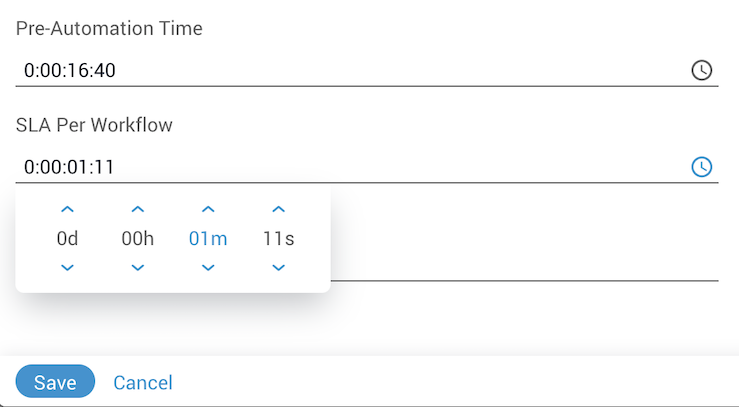
Set up savings metrics
To track metrics such as time saved and SLA target percentage, each workflow requires some additional input.
Related information
- Actionable tasks: definition of actionable tasks and detailed instructions on how to work them.