

Centralize logs with Loki and Alloy
This page is a deep dive on Grafana Loki and Grafana Alloy as a log management solution for Itential Platform and Itential Gateway. It’s the companion to Manage logs and is intended for operators who have already decided to adopt Loki and Alloy and need to deploy, configure, and operate the stack day to day.
If you haven’t read the Loki and Alloy overview in Manage logs yet, start there. This page picks up where that overview leaves off.
Overview
Loki is a horizontally scalable log aggregation system built by Grafana Labs. It indexes log streams by a small set of labels, such as job, env, and host, rather than by full-text content, which keeps storage and operational costs significantly lower than search-engine-based alternatives such as Elasticsearch.
Alloy is Grafana’s component-based observability collector and the official successor to Promtail. In this deployment, Alloy is scoped to log collection, where it plays the same role Promtail used to: discover log sources on each host, tail them continuously, attach labels, and forward each line to Loki over HTTP.
This combination gives you:
- A single log aggregation backend for both VM-based and Kubernetes-based Itential deployments.
- Native Grafana integration. Log queries, log-derived metrics, and log-based alerts all use the same Grafana instance and the same alerting infrastructure you already use for Prometheus metrics.
- A query language, LogQL, that’s intentionally similar to PromQL, so if your team already writes Prometheus queries, there’s very little new to learn.
- A forward-looking agent. Promtail is in maintenance-only status. Alloy is the actively developed path, and the same binary can also collect Prometheus metrics and OpenTelemetry traces if you choose to consolidate agents later.
Architecture
A single Loki instance is the central destination for log streams from every Itential host. Alloy runs differently on virtual machines than it does on Kubernetes, but the data flow is identical from Loki onward.
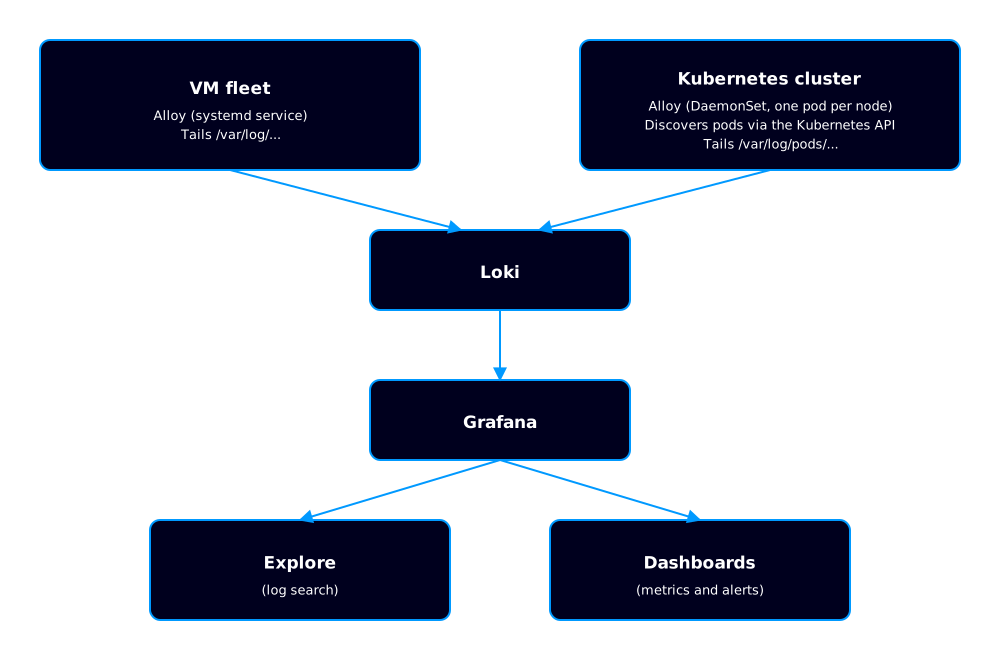
Every arrow from Alloy to Loki is an HTTP POST to Loki’s /loki/api/v1/push endpoint, optionally over TLS. Grafana queries Loki using Loki’s own HTTP API. No agent on an Itential host ever talks to Grafana directly.
Why Alloy and not Promtail
Promtail and Alloy serve the same role in this stack: discover logs, tail them, and push to Loki. Alloy is the supported path going forward. Promtail has entered maintenance-only mode and receives only security fixes from Grafana Labs.
For this deployment, Alloy is scoped identically to Promtail’s former role. Consolidating metrics and trace collection into the same agent is a follow-on benefit, not a requirement.
If you have an existing Promtail deployment, plan a transition rather than running both agents side by side. A host running both Promtail and Alloy produces duplicate log streams in Loki.
Label convention
Loki’s storage and query performance depend on keeping the label set small and low-cardinality. Every log stream from an Itential host carries the following labels.
Recommended job values for Itential components
Using these values keeps your LogQL queries and Grafana dashboards portable across environments and consistent with Itential’s reference implementation.
Cardinality rule
Never use a high-cardinality value as a label. Specifically, don’t put any of the following into a Loki label:
- Request IDs, job IDs, or correlation UUIDs
- URLs or URL paths
- User identifiers or session IDs
- Client request IP addresses
- Any field whose value space keeps growing over time
Each unique combination of label values creates a new stream in Loki. A single high-cardinality label can produce millions of streams and degrade query performance or exhaust your ingestion limits. Parse those fields out of the log line at query time instead, using LogQL’s pattern, regexp, or json parsers. The Loki query layer is designed for this; the index layer isn’t.
Deploy Loki
For a typical Itential deployment, Loki runs as a single-node monolithic instance. This mode uses filesystem storage and an in-memory ring, which is the simplest operational footprint and is sufficient for most platform monitoring workloads. If you need high availability or object storage, refer to Loki’s distributed deployment topology in the upstream documentation.
You have two practical choices for where to run Loki.
Option 1: Loki on a dedicated VM (systemd)
Choose this option when most of your Itential deployment runs on VMs and you don’t have a Kubernetes cluster available for the monitoring stack itself. Loki is distributed as a single Go binary and runs as a systemd service.
- Install on RHEL/Rocky Linux 9 or an equivalent distribution.
- Co-locating Loki with Grafana on the same VM is supported and common for development or smaller production deployments.
- Storage is local filesystem. Size it for your retention target; see Plan retention and sizing.
- Open TCP
3100(the HTTP API and push endpoint) to every Alloy host. TCP9096(gRPC) is only needed for multi-component topologies.
Refer to Grafana’s Loki installation documentation for the binary download and systemd setup.
Option 2: Loki in Kubernetes (Helm)
Choose this option when Itential runs in Kubernetes, or when a separate Kubernetes cluster is available for the monitoring stack.
- Deploy Grafana Labs’ official Loki Helm chart in
monolithicmode. - Back the StatefulSet with a PersistentVolumeClaim sized for your retention target.
- Expose Loki through a
ClusterIPservice for in-cluster Alloy, or through aLoadBalancerif Grafana lives outside the cluster.
Refer to Grafana’s Loki Helm installation documentation.
Minimal Loki configuration
A monolithic Loki instance reads its configuration from a loki-config.yml file. The relevant sections look like this:
The Helm chart maps these same settings to chart values; the underlying configuration is identical.
Deploy Alloy on virtual machines
On VM-based Itential deployments, Alloy runs as a systemd service on every host that produces logs: Platform, Gateway, MongoDB, and Redis. Alloy is distributed by Grafana Labs as an official RPM and DEB package.
Install Alloy
Add the Grafana RPM repository (or the DEB equivalent on Debian/Ubuntu) and install the alloy package with your distribution’s package manager. Refer to Grafana’s Alloy installation documentation.
After installation:
- Add the
alloysystem user to thesystemd-journalgroup so it can read the journal. - For log files that aren’t world-readable, add the
alloyuser to the appropriate group. The MongoDB log (/var/log/mongodb/mongod.log) is owned bymongod:mongod, and the Gateway log is owned byitential:itential. Without group membership, Alloy fails to tail those files without raising an error you’d notice right away. - Open TCP
12345in the host firewall if you want access to Alloy’s local UI for diagnostics. - If a Promtail service already exists on the host, stop and disable it before starting Alloy. Running both produces duplicate log streams.
Configure Alloy
Alloy’s configuration is a single file at /etc/alloy/config.alloy, written in Alloy’s component-based DSL. The pipeline for VM-based collection has three parts: the Loki push destination, the systemd journal source, and the application log file sources.
The same pattern applies to Gateway, MongoDB, and Redis hosts. Change the __path__ and job label for each file.
In cloud environments, set loki.write to the private or VPC-internal address of the Loki host. EC2 and Azure VMs can’t route to their own public IP addresses. Using the public IP is the single most common misconfiguration in this stack.
Alloy stores its read position for each file at /var/lib/alloy/positions.yaml. This file survives restarts and ensures no log lines are duplicated or lost when the Alloy service restarts.
Deploy Alloy on Kubernetes
On Kubernetes-based Itential deployments, Alloy runs as a DaemonSet, with one pod per node. Each pod uses the Kubernetes API to discover the pods running on its own node and tails their container logs from the node filesystem under /var/log/pods/.
Install Alloy
Deploy Grafana Labs’ official Alloy Helm chart, or the Helm chart that ships with the Itential reference implementation. Refer to Grafana’s Alloy on Kubernetes documentation.
The DaemonSet requires:
- A
ServiceAccountwith aClusterRolethat grantsget,list, andwatchonnodes,namespaces, andpods. This is the minimum scope needed for pod discovery. - HostPath mounts for
/var/log/pods(read-only) and/var/lib/alloy(read-write, for the positions file). runAsUser: 0on most container runtimes, because kubelet writes container logs as root.
Configure Alloy
The Alloy configuration for Kubernetes has four parts: a Loki push destination, pod discovery through the Kubernetes API, a relabel block that maps Kubernetes metadata onto the label convention above, and a file-tailing block that reads the discovered log files.
The HOSTNAME_NODE environment variable is set on each Alloy container from the Kubernetes downward API (spec.nodeName). The field selector ensures each Alloy pod only watches its own node’s workloads, which scales linearly with cluster size.
Set the job label on Itential pods
The relabel rule above reads the logs.itential.com/job pod annotation and uses its value as the Loki job label. To label a Platform pod’s logs as iap, add this to the pod template, not the Deployment metadata:
Apply the same pattern to Gateway pods (iag), and to any Kubernetes-hosted MongoDB or Redis (mongodb, redis, redis-sentinel). A pod without this annotation has no job label set, so a query filtering on {job="iap"} won’t match it.
Static pods on control-plane nodes (etcd, kube-apiserver, kube-controller-manager, kube-scheduler) write to a directory that uses a config hash rather than the pod UID, so the default __path__ template above doesn’t match them. Real workloads, meaning any Deployment, StatefulSet, DaemonSet, or Job, all work correctly. If you need control-plane log coverage, add a second loki.source.file block tailing /var/log/containers/*.log.
Connect Loki to Grafana
Loki is a first-class data source in Grafana. No plugins are required.
Configure manually through the UI
- In Grafana, go to Connections > Data sources > Add data source > Loki.
- Set the URL to your Loki endpoint:
- VM-based Loki:
http://<LOKI-HOST-PRIVATE-IP>:3100 - Kubernetes-based Loki in the same cluster:
http://loki.<namespace>.svc:3100
- VM-based Loki:
- Save and test. A green “Data source is working” indicator confirms connectivity.
Provision the data source (recommended for production)
Provision the data source through Grafana’s configuration files so the connection survives Grafana restarts and is reproducible across environments. Drop a YAML file under Grafana’s provisioning/datasources/ directory:
For Helm-deployed Grafana, the official chart includes a sidecar (kiwigrid/k8s-sidecar) that auto-mounts any ConfigMap labeled grafana_datasource=1 as a data source. This is the cleanest way to wire Loki up when both Grafana and Loki run in the same cluster.
Once the data source is connected, log queries become available in Explore, and you can add Loki-backed panels to any dashboard. A single dashboard can mix Prometheus and Loki panels freely.
Query logs with LogQL
LogQL is Loki’s query language. It has two forms: log queries, which return matching log lines, and metric queries, which derive time-series numbers from log content. Both start with a label selector in curly braces.
Log queries
The basic shape is {label="value"} | filter | parse.
Find every error line in the Platform web server log over the time range selected in Grafana:
Find Gateway errors that mention a specific device name, excluding noisy heartbeat lines:
Parse the HTTP status code out of a Platform web server log line, then filter on it:
Metric queries
A metric query wraps a log query in an aggregation function. The result is a time series that Grafana can plot like any Prometheus metric.
HTTP 5xx error rate per host, over the last 5 minutes:
Top 10 URLs returning a 5xx status, over the last hour:
Error rate compared across environments:
Gateway device interaction throughput, by gateway host:
MongoDB connection-rejected events per minute:
For the full LogQL reference, including operators, parsers, and aggregations, see Grafana’s LogQL documentation.
Create recording rules for high-volume streams
A LogQL metric query is evaluated by scanning matching log streams at query time. For a dashboard that refreshes frequently, or a query over a high-volume stream such as the Platform web server log or a large Gateway fleet, that scan can become slow or expensive.
A Loki recording rule pre-computes a metric query on a schedule and stores the result. Dashboard panels then query the pre-computed metric instead of scanning raw logs. This is the same pattern Prometheus uses for its own recording rules.
A recording rule for the Platform HTTP 5xx error rate looks like this:
Drop this file under Loki’s rules/ directory, or configure the ruler component to load it from object storage. A Grafana panel can then query the recorded metric directly:
Use a recording rule when:
- A LogQL metric query powers a panel that refreshes every 10 seconds or faster.
- A panel aggregates over a window longer than 15 minutes.
- An alert rule needs to evaluate consistently regardless of dashboard load.
Plan retention and sizing
Loki enforces retention through two complementary mechanisms.
reject_old_samples_max_age
This is the primary retention control. Loki rejects writes for log lines older than this age. The default is 168h (7 days). To retain logs for 30 days, set 744h. To retain for 90 days, set 2160h.
This setting rejects new writes of old data; it doesn’t delete existing chunks. With filesystem storage and the schema in this guide, old chunks stay on disk until you remove them or run Loki’s compactor with a retention policy enabled. For most VM-based deployments, the simpler approach is to size the disk for your retention target and let the natural ingest cadence keep storage bounded.
Ingestion rate limits
The defaults handle most Itential deployments. Increase them only when Loki starts rejecting writes with 429 Too Many Requests errors, which Alloy surfaces in its own logs. A reasonable starting point for a busy production deployment is 32 / 64.
Estimate storage
Loki compresses log chunks aggressively, typically at a 5:1 to 10:1 ratio against raw log volume. To estimate disk usage:
- Measure raw log volume per host per day, in bytes. For a typical Platform host, this is in the range of 100 MB to 1 GB per day depending on traffic and adapter activity.
- Multiply by the number of hosts sending logs.
- Divide by the expected compression ratio. Use
5for a conservative estimate. - Multiply by the retention period in days.
For example, a 10-host deployment averaging 500 MB per host per day with 30-day retention: 10 × 500 MB × 30 / 5 = 30 GB. Provision 60 to 90 GB to leave headroom for the index and future growth.
Secure the Alloy-to-Loki connection
By default, Alloy ships logs to Loki over plain HTTP. For a production deployment where that traffic crosses a network boundary (between subnets, VPCs, or clusters), encrypt the connection with TLS.
Configure the Loki side
Provision a server certificate and private key for the Loki host. Place them at predictable paths and enable TLS in loki-config.yml:
Restart Loki. The HTTP push endpoint now requires HTTPS, and so do the /ready and /metrics endpoints.
Configure the Alloy side
Place the CA certificate that signed Loki’s server certificate on every Alloy host, or mount it as a Kubernetes secret in the DaemonSet case. Update the Alloy loki.write block to use HTTPS and reference the CA:
For mutual TLS, where Loki also verifies the Alloy client, add cert_file and key_file to the tls_config block and configure Loki’s http_tls_config with client_auth_type: RequireAndVerifyClientCert and a client_ca_file.
Certificate distribution is intentionally out of scope for these tools. Use your existing certificate management process, such as cert-manager in Kubernetes, an internal PKI, or Ansible Vault.
Verify the pipeline
After deployment, verify each stage of the pipeline, from Alloy through Loki to Grafana.
Verify Loki is healthy
Verify Alloy is tailing files
On a VM:
On Kubernetes:
Check Alloy’s own logs for errors:
Alloy also exposes a local UI at http://<host>:12345 showing each component’s state, target counts, and any pipeline errors. This is the fastest way to confirm discovery is working.
Verify logs are landing in Loki
Query the list of labels Loki has seen:
Query the values for the job label:
Pull a few recent lines for Platform:
Verify Grafana can query Loki
Open Grafana, go to Explore, select the Loki data source, and run:
Recent Platform log lines should appear within seconds. If they don’t, work backward through the verification steps above.
Troubleshoot
No logs are appearing in Grafana
- Confirm Loki is reachable from the Alloy host: run
curl http://<LOKI-HOST>:3100/readyfrom the Alloy host itself, not from your workstation. Cloud security groups and VPC firewalls block this most often. - Confirm
<LOKI-HOST>resolves to the private IP, not the public one. EC2 and Azure VMs can’t route to their own public addresses. - Look at Alloy’s own logs for push errors (
status=4xxorstatus=5xxfromloki.write). - Check Loki’s logs for ingestion rejections.
Alloy starts, but no application log streams appear
- Verify the file paths in the Alloy config match the actual files on disk.
- Verify the
alloyuser has read access. A permissions issue on/var/log/mongodb/mongod.log(mode0640, ownermongod:mongod) or/var/log/gateway/gateway.log(mode0660, owneritential:itential) is a common cause. - Add the
alloyuser to the file owner’s group, restart Alloy, and check again.
Loki rejects writes with “429 Too Many Requests”
You’ve hit the ingestion rate limit. Either reduce log volume by filtering at the source with a loki.relabel drop rule, or raise ingestion_rate_mb and ingestion_burst_size_mb in Loki’s limits_config.
Query performance degrades over time
This is almost always a label cardinality problem. Use Loki’s series API to find the offending label:
A value in the tens of thousands or higher for a single job indicates a high-cardinality value has leaked into a label. Identify the offending label, remove it from the Alloy config, and parse the field at query time instead.
Static pods don’t appear in Kubernetes logs
This is expected with the default configuration. A static pod (a control-plane component on a Kubernetes control-plane node) writes to a directory that uses a config hash rather than the pod UID, and the default __path__ template doesn’t match it. Add a second loki.source.file block tailing /var/log/containers/*.log if you need control-plane log coverage.
The Alloy positions file grows large
The positions file at /var/lib/alloy/positions.yaml (or the hostPath mount in Kubernetes) grows as Alloy tracks more files. Growth up to a few megabytes is normal. If it grows past 100 MB, a path pattern is likely matching far more files than you expect. Check for log rotation files (*.log.1, *.log.gz) being unintentionally tailed, and restrict the __path__ glob to current files only.