

Troubleshoot network performance
Use the following checklists to help identify and resolve performance issues. Every environment and problem is unique — these checklists provide a baseline to guide you. If you are unable to resolve any problem areas or have questions, contact the Itential Product Support Team.
Common performance issues
Performance issues you may encounter include:
- Itential Platform UI loads slowly.
- Jobs are running slower than usual.
- Apps and their functions are unresponsive or working slowly.
- Pronghorn consumes a lot of resources.
Troubleshooting steps
My Traceroute (MTR) tool
To inspect network latency and packet loss, use mtr:
Example output:
In this report, packet loss is 0%. Average time to reach the destination is 1880ms, best is 235.2ms, worst is 2072ms.

Recovery steps
For instances where the cause of a performance issue is unknown:
- Pause the Task Worker on all Itential Platform instances to ensure in-flight tasks are completed, then restart all instances.
- If the issue persists, stop Itential Platform and restart all dependencies (MongoDB and Redis).
Recommendations
Performance database commands
Job counts
Fetch a count for jobs that have run more than 500 times (Job Metrics in Operations Manager is also available for Itential Platform 2021.2 and higher):
Jobs and tasks collection count
Fetch the jobs and tasks collection count for the full day plus every hour:
Replace UPPERBOUNDS and LOWERBOUNDS with epoch time values (in milliseconds) between two date timestamps.
MongoDB metrics
Export job metrics data for analysis. Replace "JOB-ID-HERE" with the specific job ID:
Job velocity
Validate job run and completion rates:
Check core memory usage
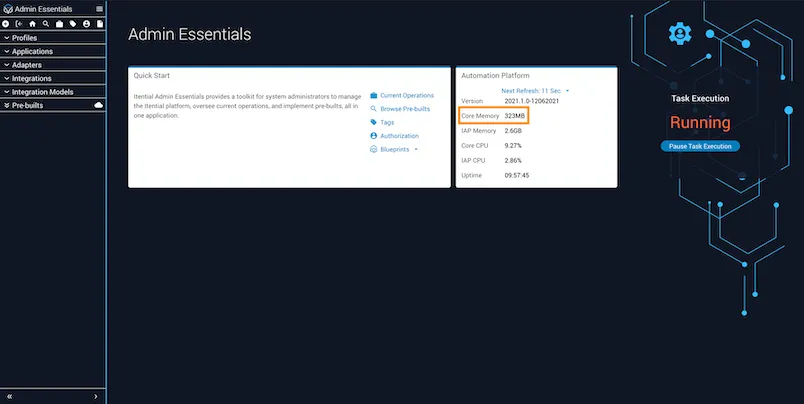
Use Admin Essentials to evaluate core memory usage.
From the Profile view, you can also check memory usage for both Applications and Adapters, and compare it to the memory being used in your local server controls.
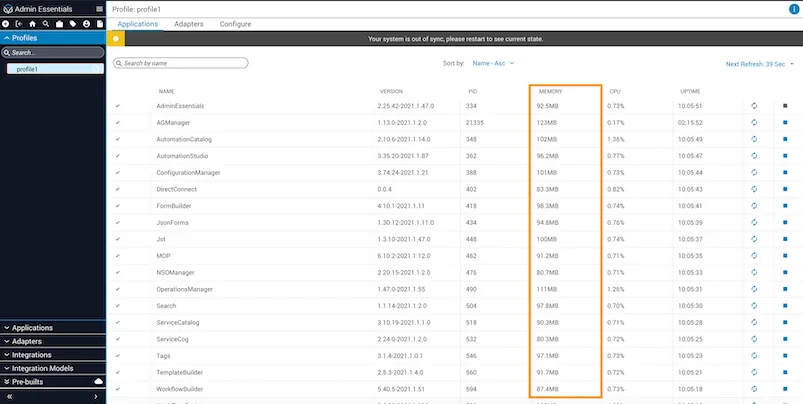
If the memory for an app keeps growing over time without decreasing, there may be a memory leak. Submit an ISD ticket with Itential for any product apps or adapters showing higher than expected memory use.