Navigate Admin Essentials
Admin Essentials is used to view, configure, and modify all admin-level properties across Itential Platform. The various features in Admin Essentials are controlled by authorization settings. Therefore, some users will not have access to all features referenced here; however, an administrator can grant access as necessary.
The main elements of Admin Essentials are referenced in the table below.
Different versions of Itential Platform may have minor variations in the Admin Essentials interface.
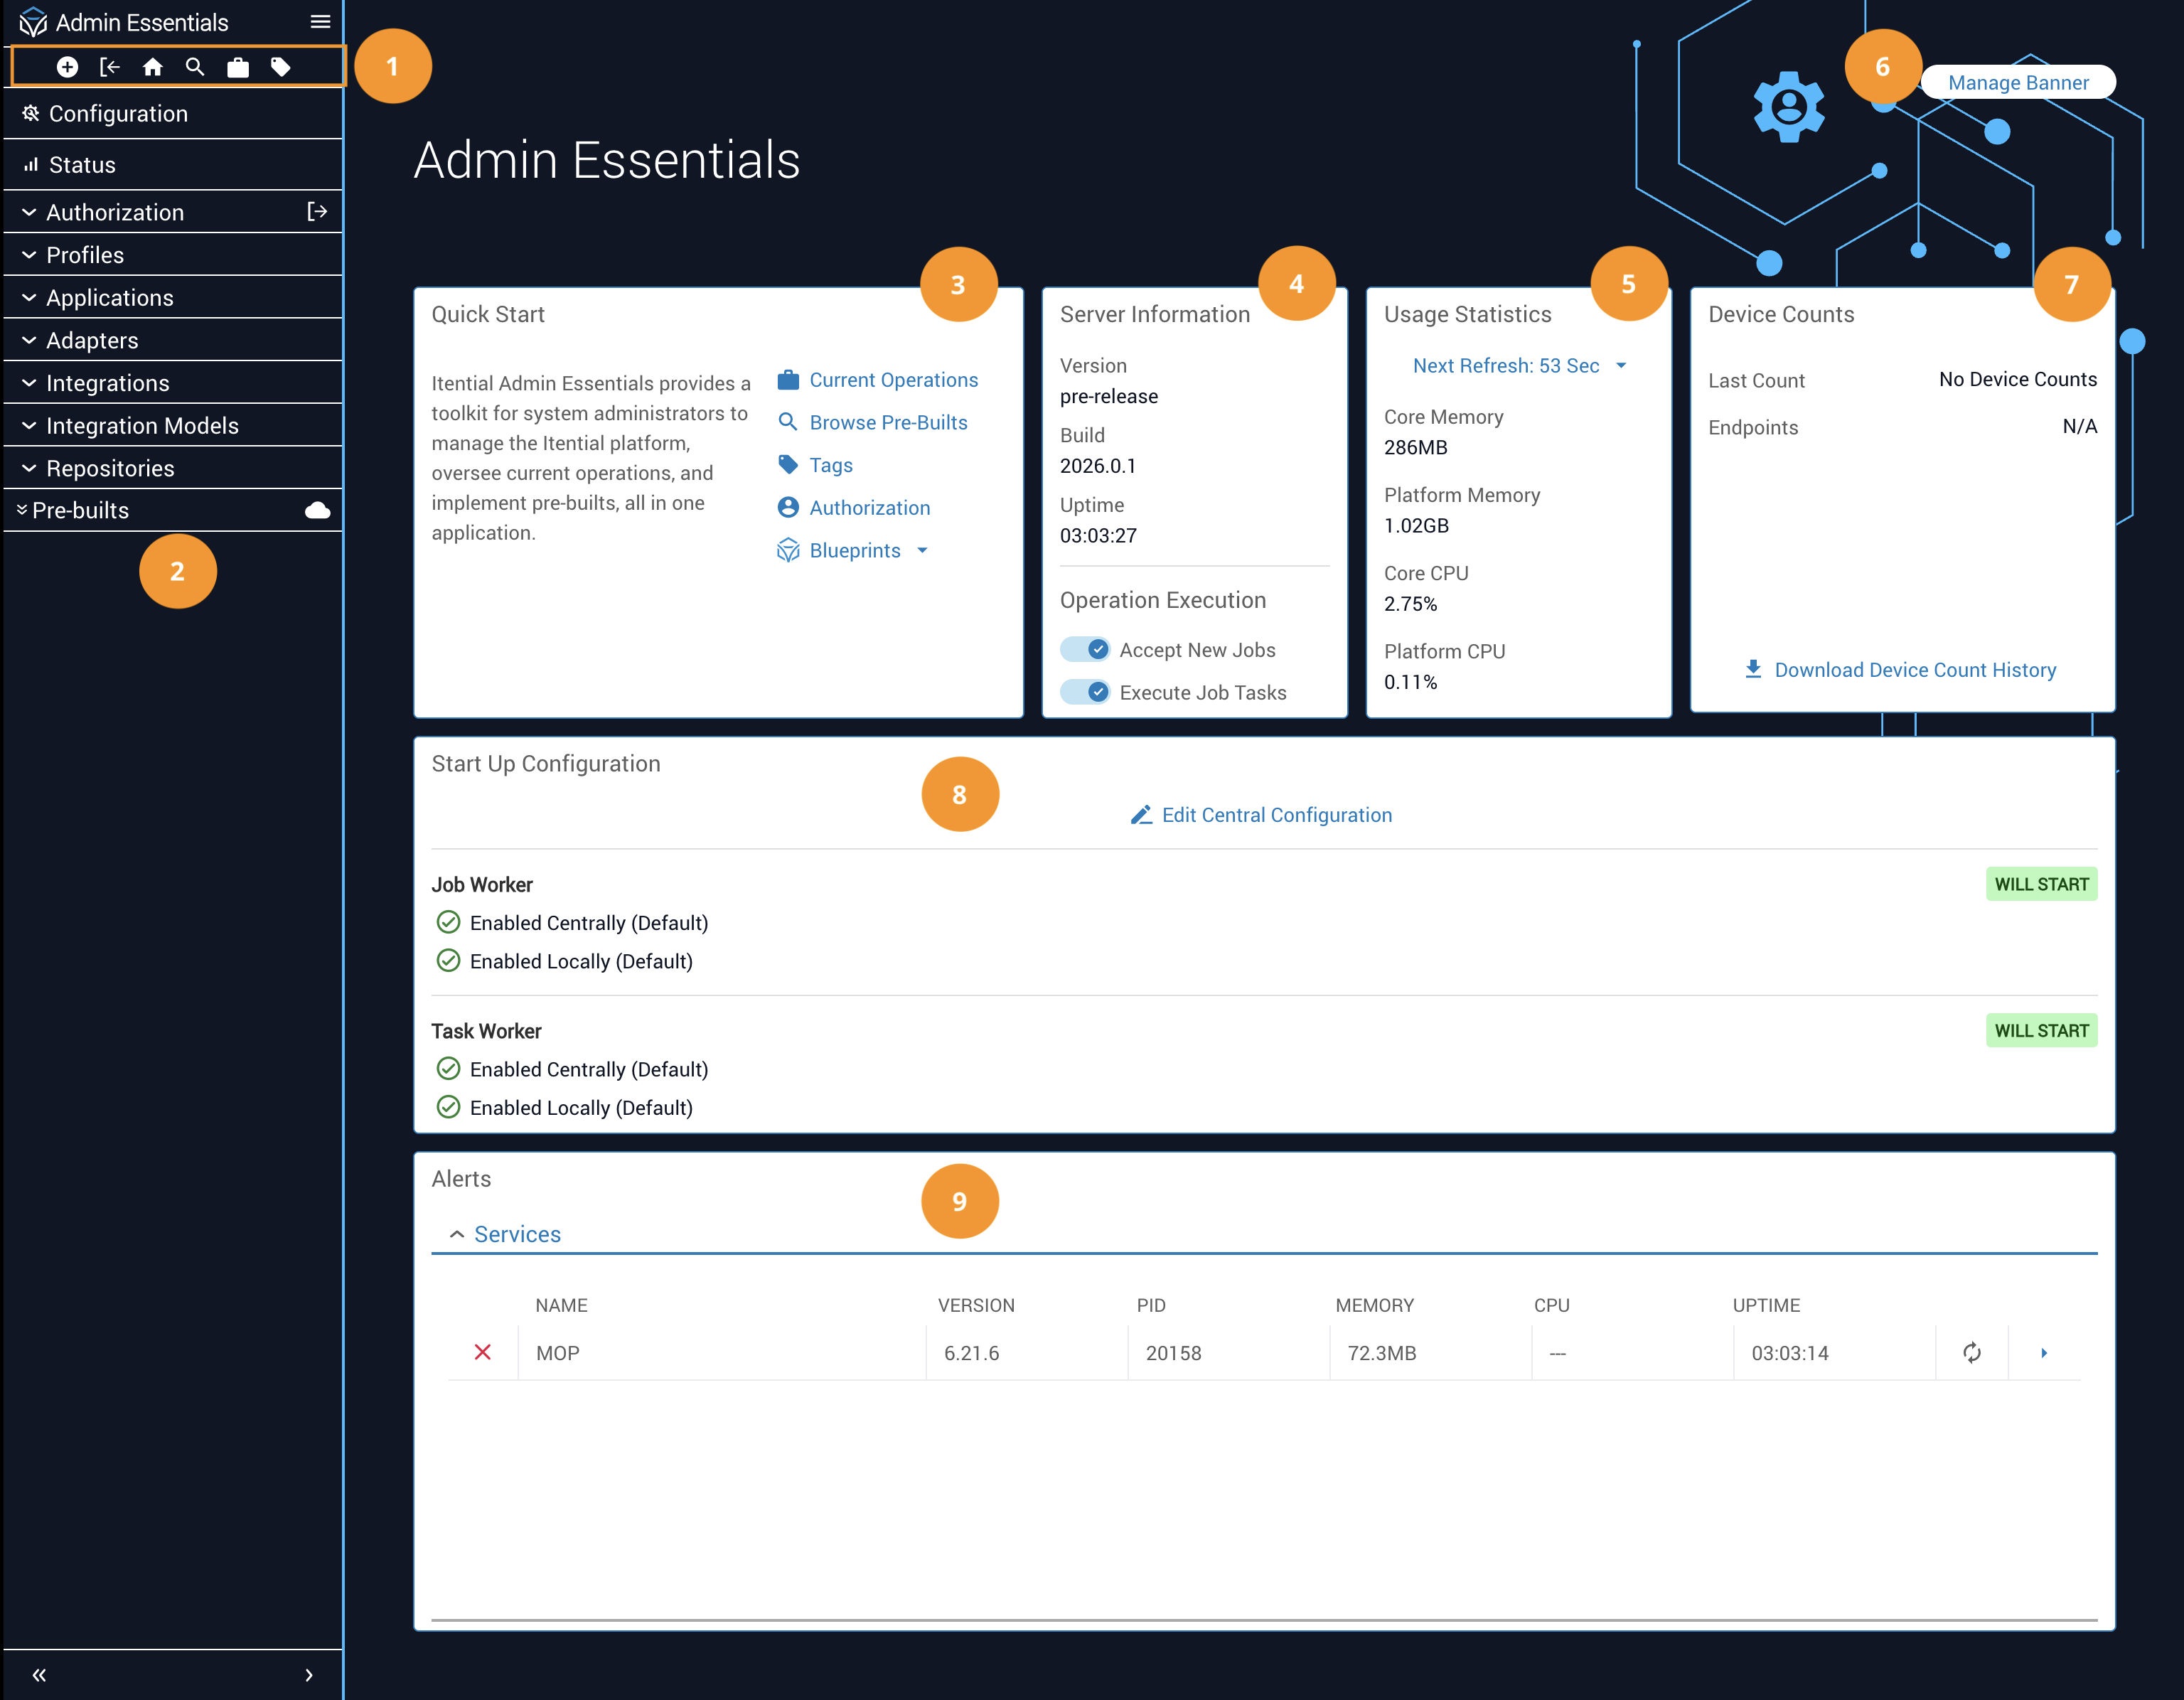
Icon bar
Current Operations
The Quick Start card on the Admin Essentials homepage contains a link to Current Operations, where you can see all running jobs and tasks through the Active Jobs and Running Tasks dialog views, respectively. Available views, features, and interactions in the Current Operations interface can be limited based on user permissions.
Tags
The Tags application from the Quick Start area of Admin Essentials makes workflows, forms, and other items search-enabled. You can create or edit tags, as well as add tags to a specific collection.
Available views, features, and interactions in the Tags application can be limited based on user permissions.
The Tags interface is straightforward to navigate:
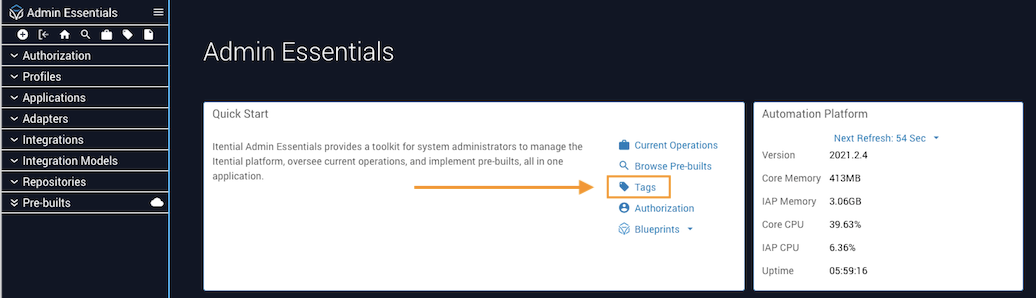
Open Tags
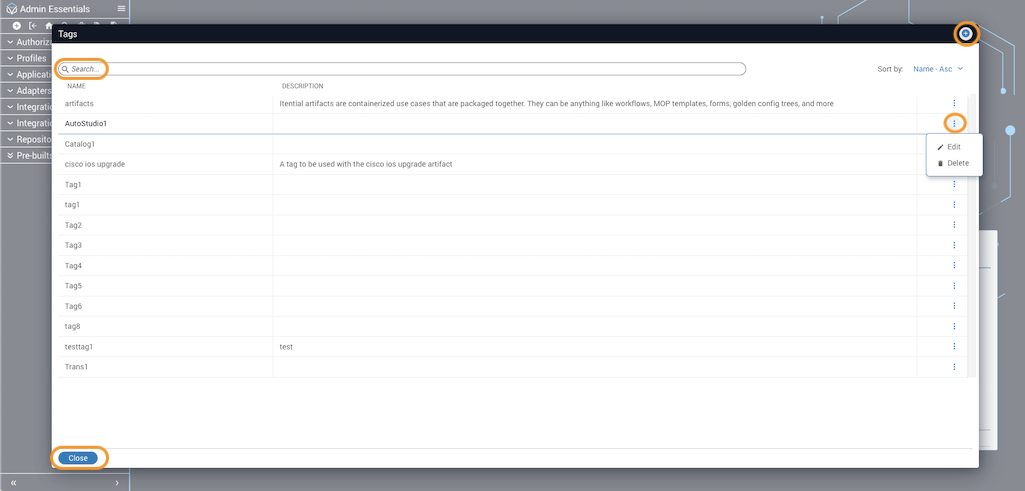
Click Tags from the Quick Start area of the Admin Essentials welcome page to open the application. The Tags dialog displays a list of items in table view.
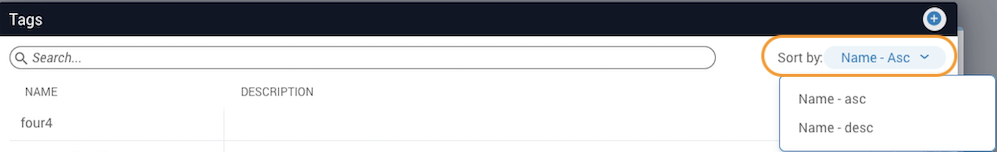
Search for a tag
Use the search bar to locate a tag from the collection list. Enter one or more characters corresponding to the tag name. A filtered list of results will return.
Creating, editing, and deleting tags
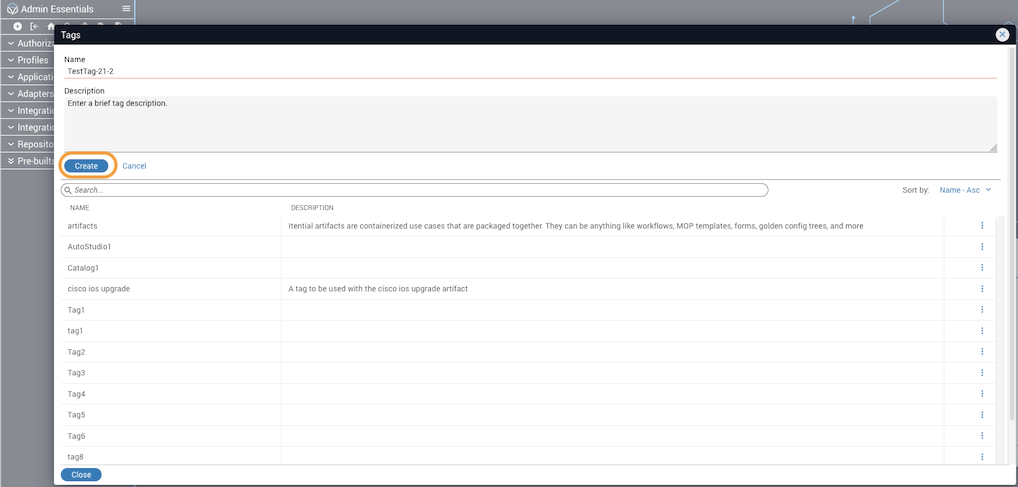
To create a new tag:
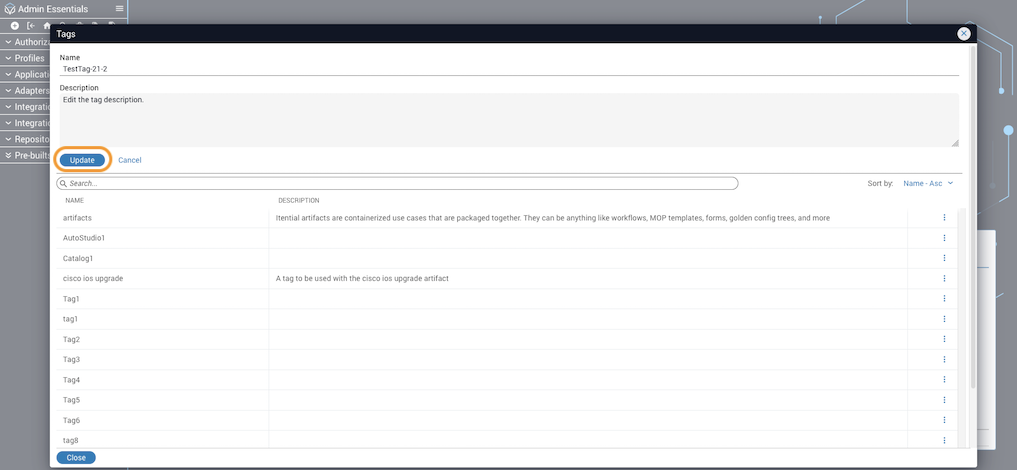
To edit a tag:
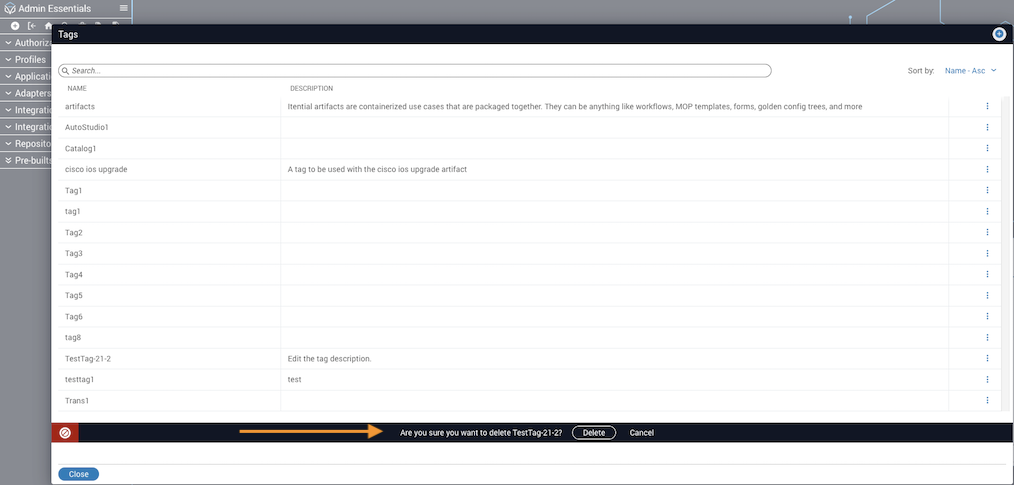
To delete a tag:
Adding tags to collections
Tags can currently be added to the following collections:
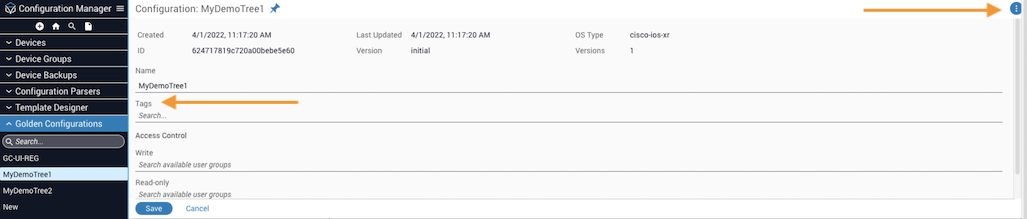
To add a tag to a Workflow, Template, or Golden Config:
Create or open an item
Create a new workflow, template, or golden config and save it — or open an existing one.
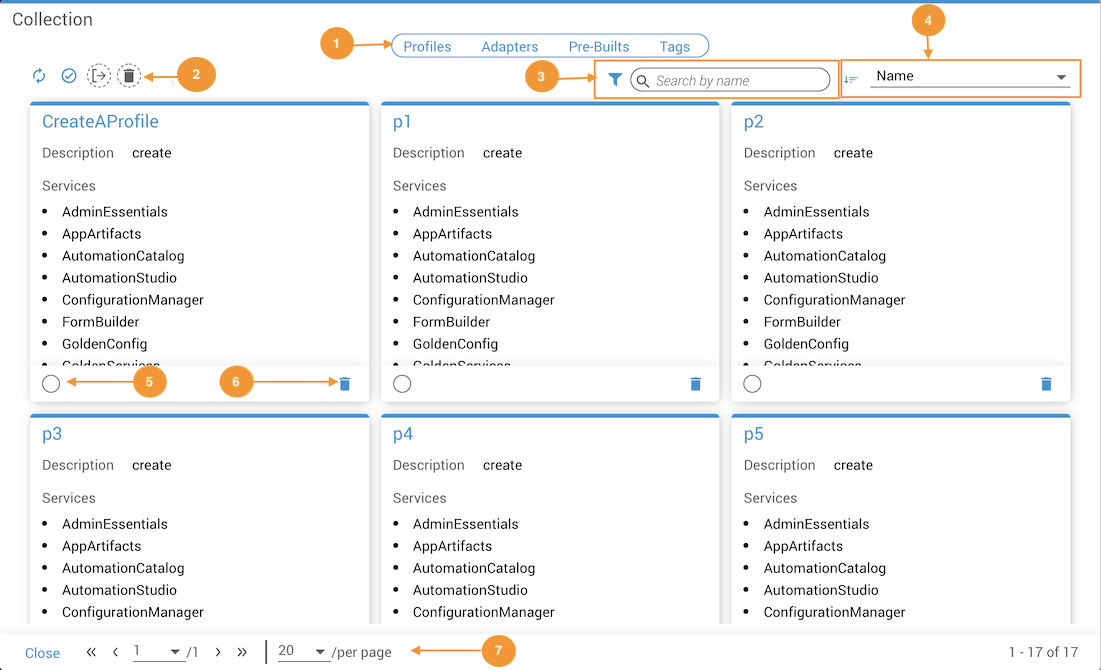
Collection lists
The Collection dialog displays all items in a collection as cards with services information relevant to the collection item.
Active Jobs
From the Active Jobs view on the Current Operations page, you can see all active running jobs. When this view is open, the page refreshes automatically every 60 seconds.
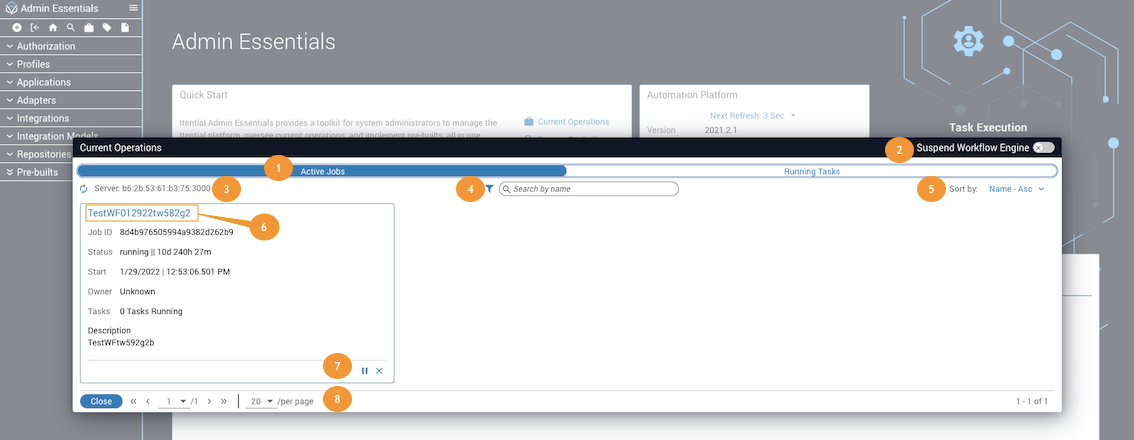
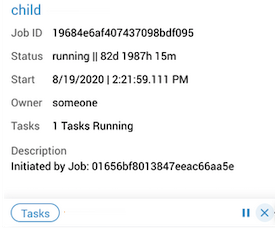
If there are running tasks in a job, a Tasks button will appear in the card footer of the job. Clicking this button switches you to the Task view.
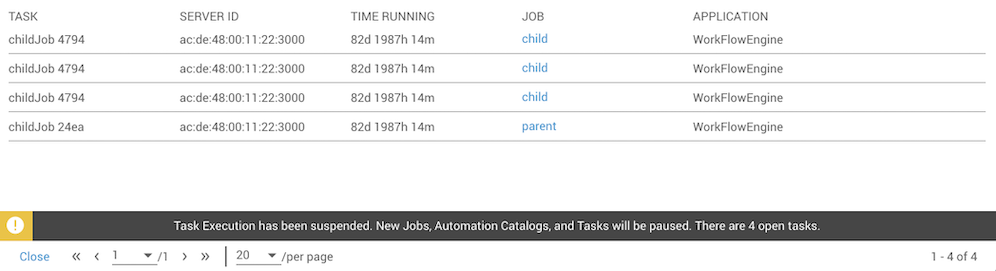
Running Tasks
The Running Tasks tab shows all running tasks in a table view. Clicking a job name link under the Job column will open the Job Details page. When tasks are suspended via the Task Worker Switch, a warning banner displays indicating how many tasks are currently running.

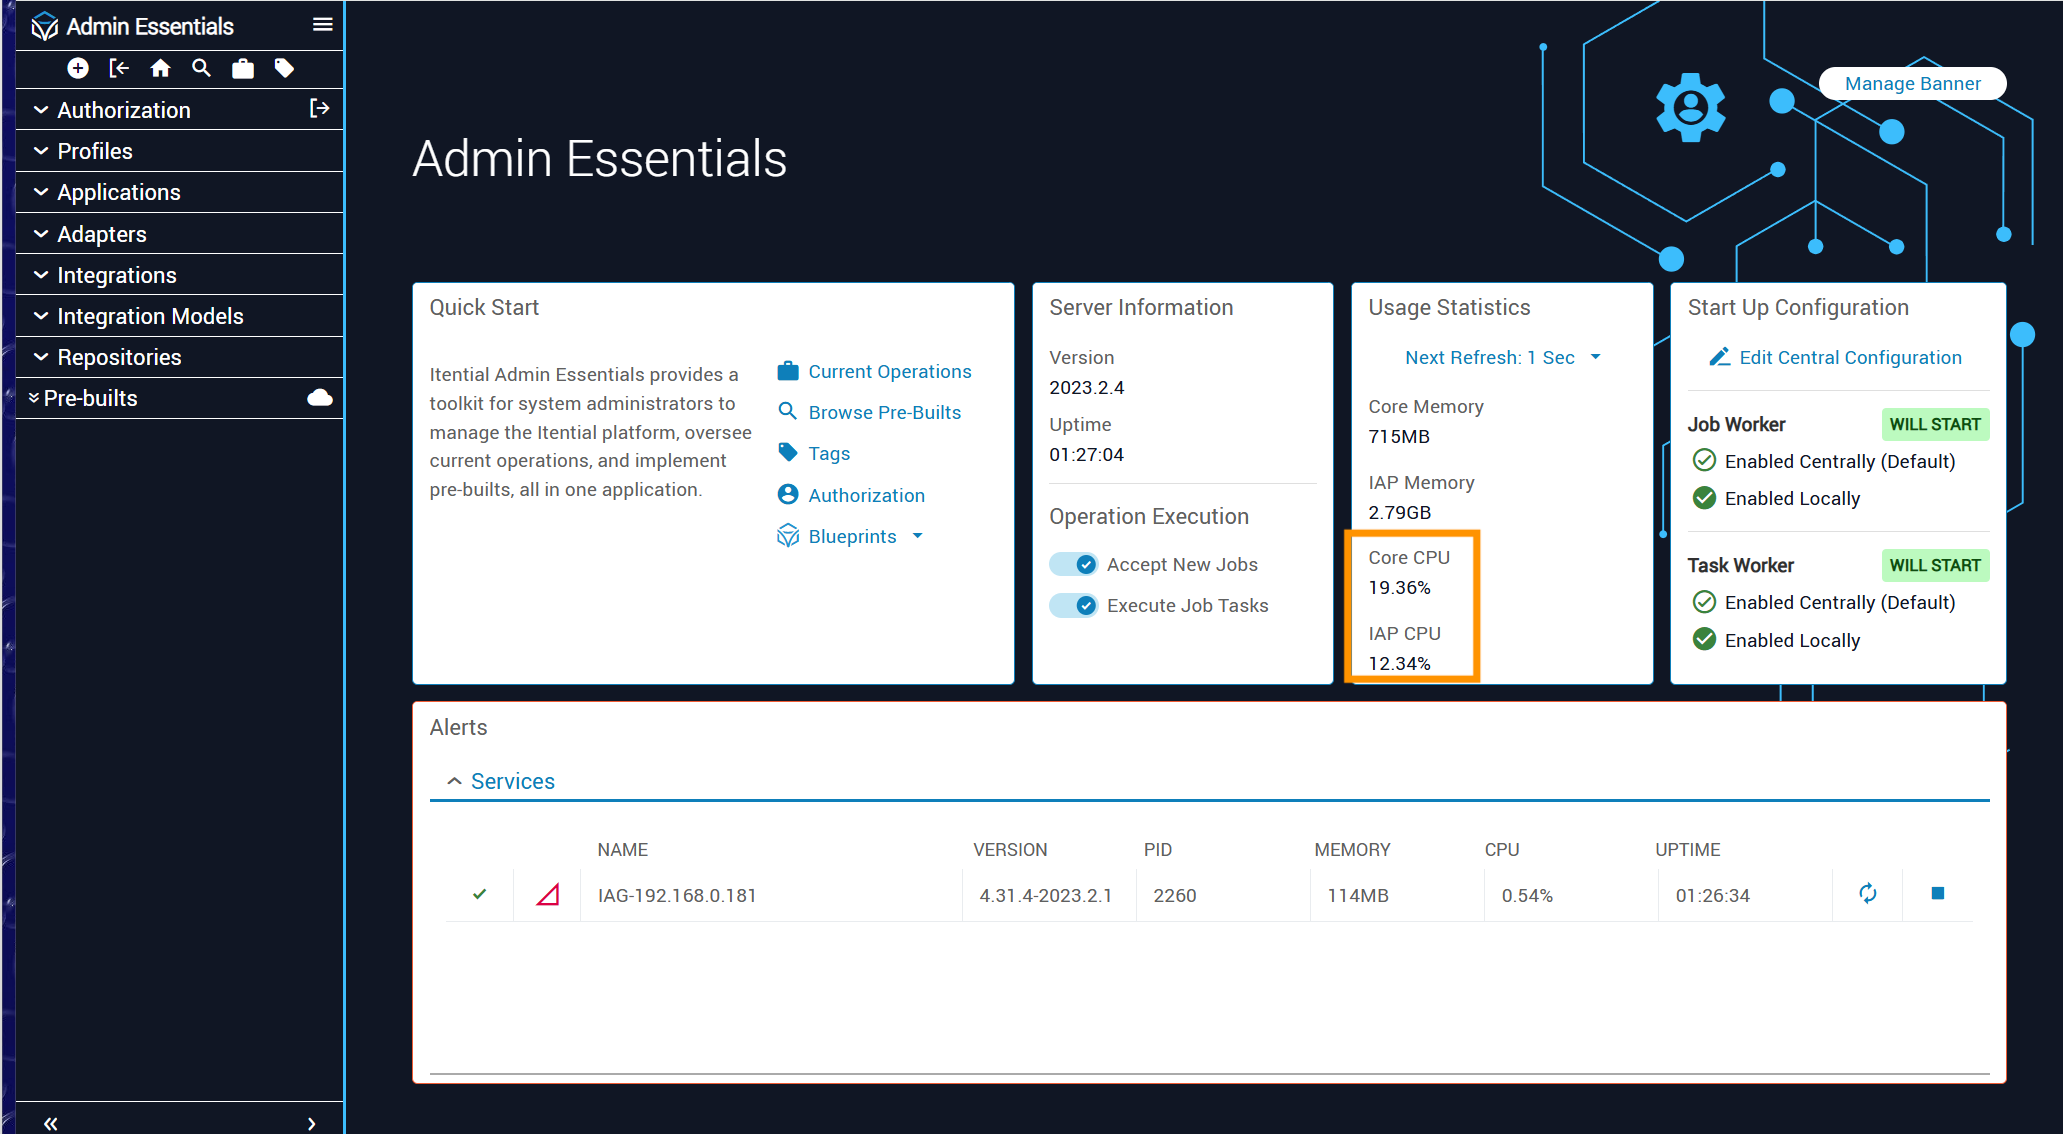
Usage Statistics
Usage Statistics on the main Admin Essentials page are snapshot measurements of Itential Platform service-related items only.
- Itential does NOT measure Redis, Rabbit, Mongo, Python, NSO, or other node server processes.
- Itential also does NOT measure load averages (the amount of traffic to your CPU over the past 1 min, 5 min, and 15 min).
- The measurement you see in Admin Essentials is a snapshot view, not real-time, and only Itential Platform/Pronghorn related.
For insight into what is consuming CPU resources, navigate to the Applications or Adapters tab under Profiles to get a more granular snapshot view. Itential also recommends utilizing system-level tools like top to give more detailed analysis, as described below.
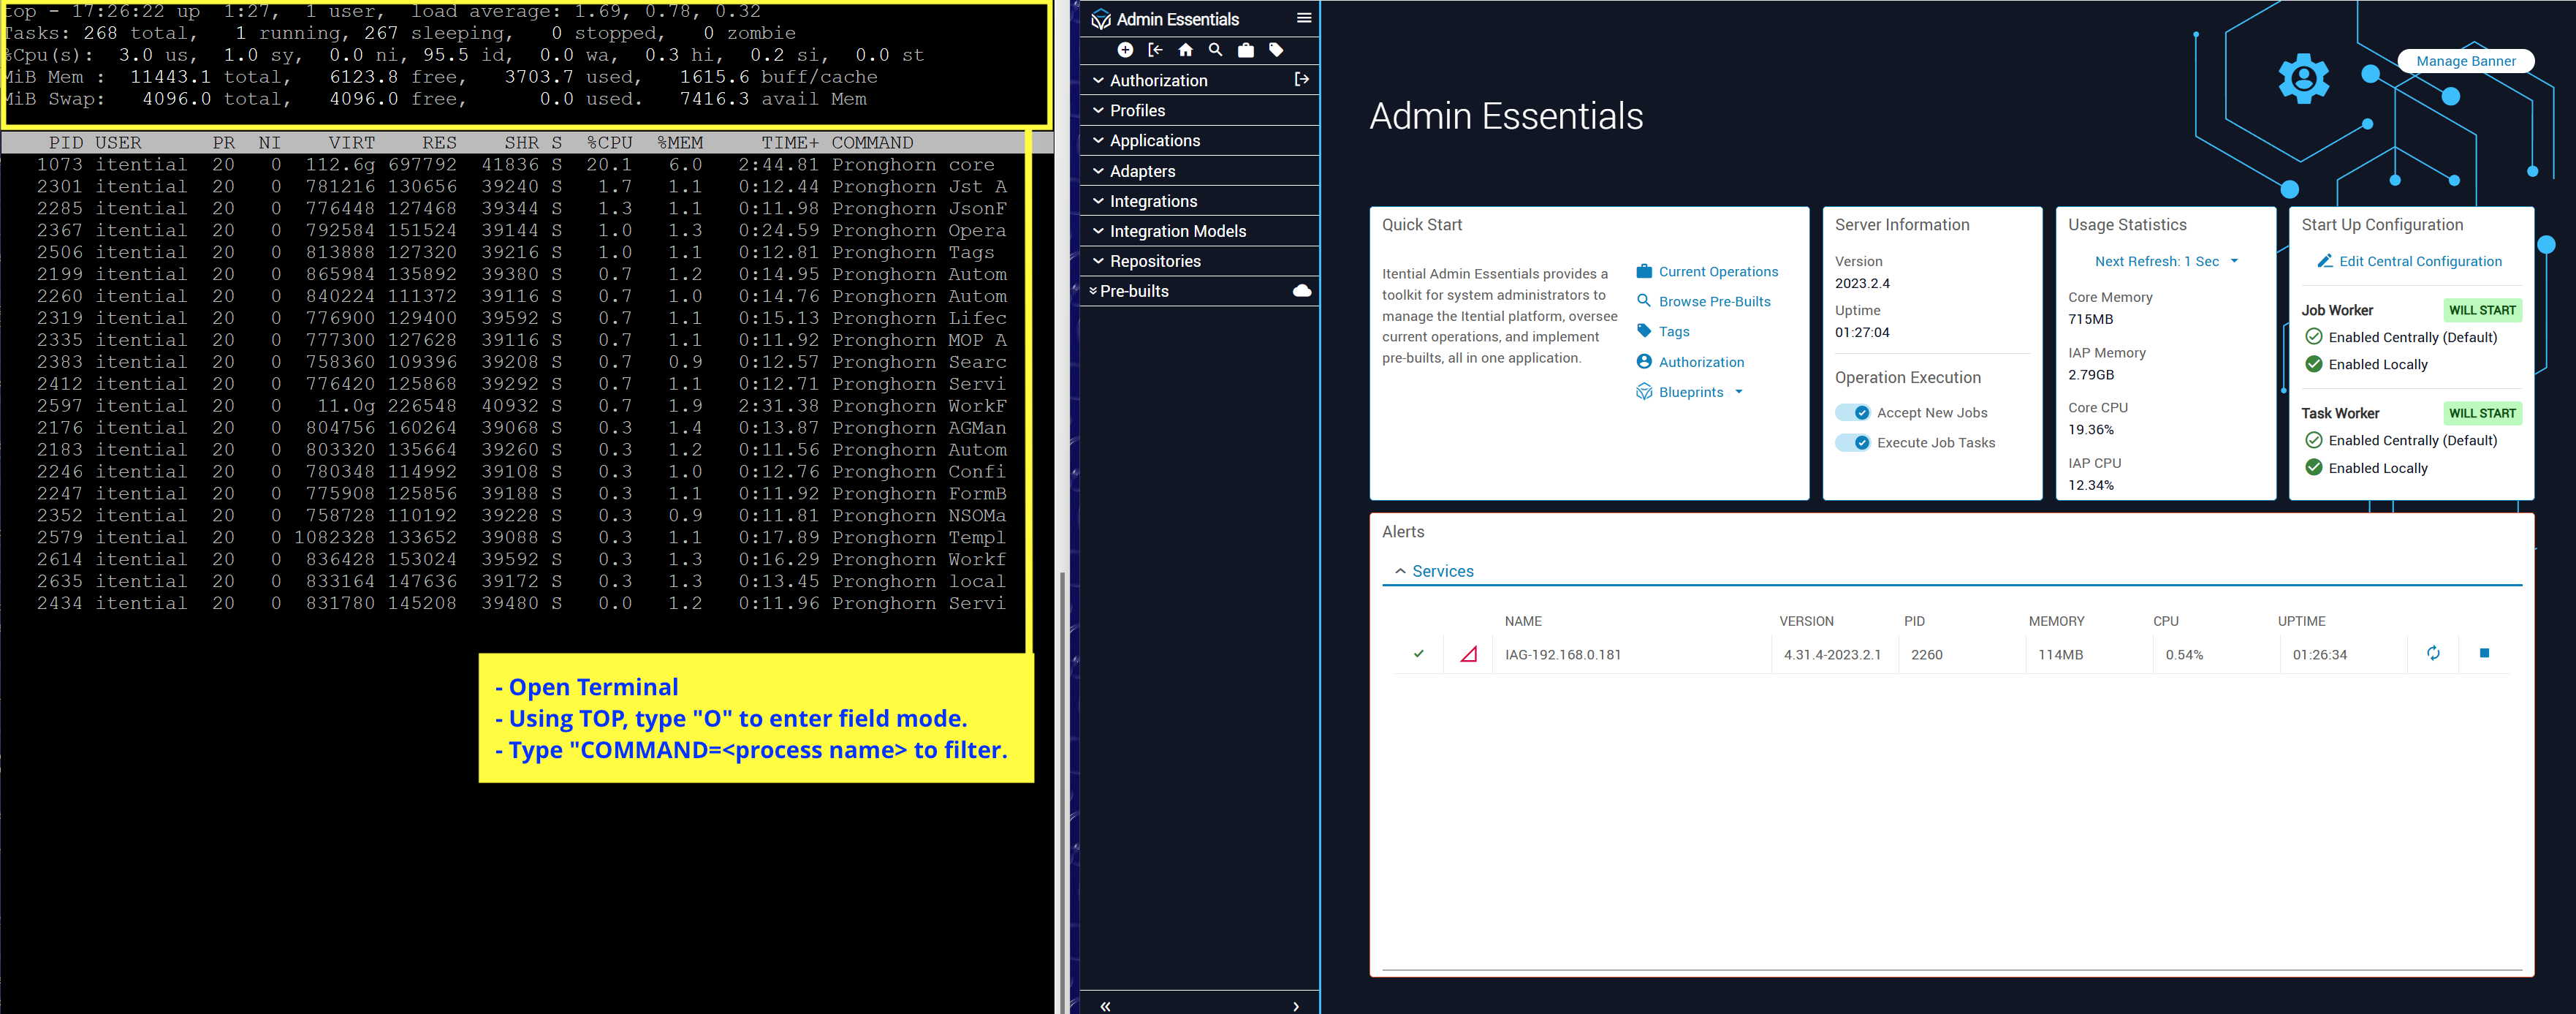
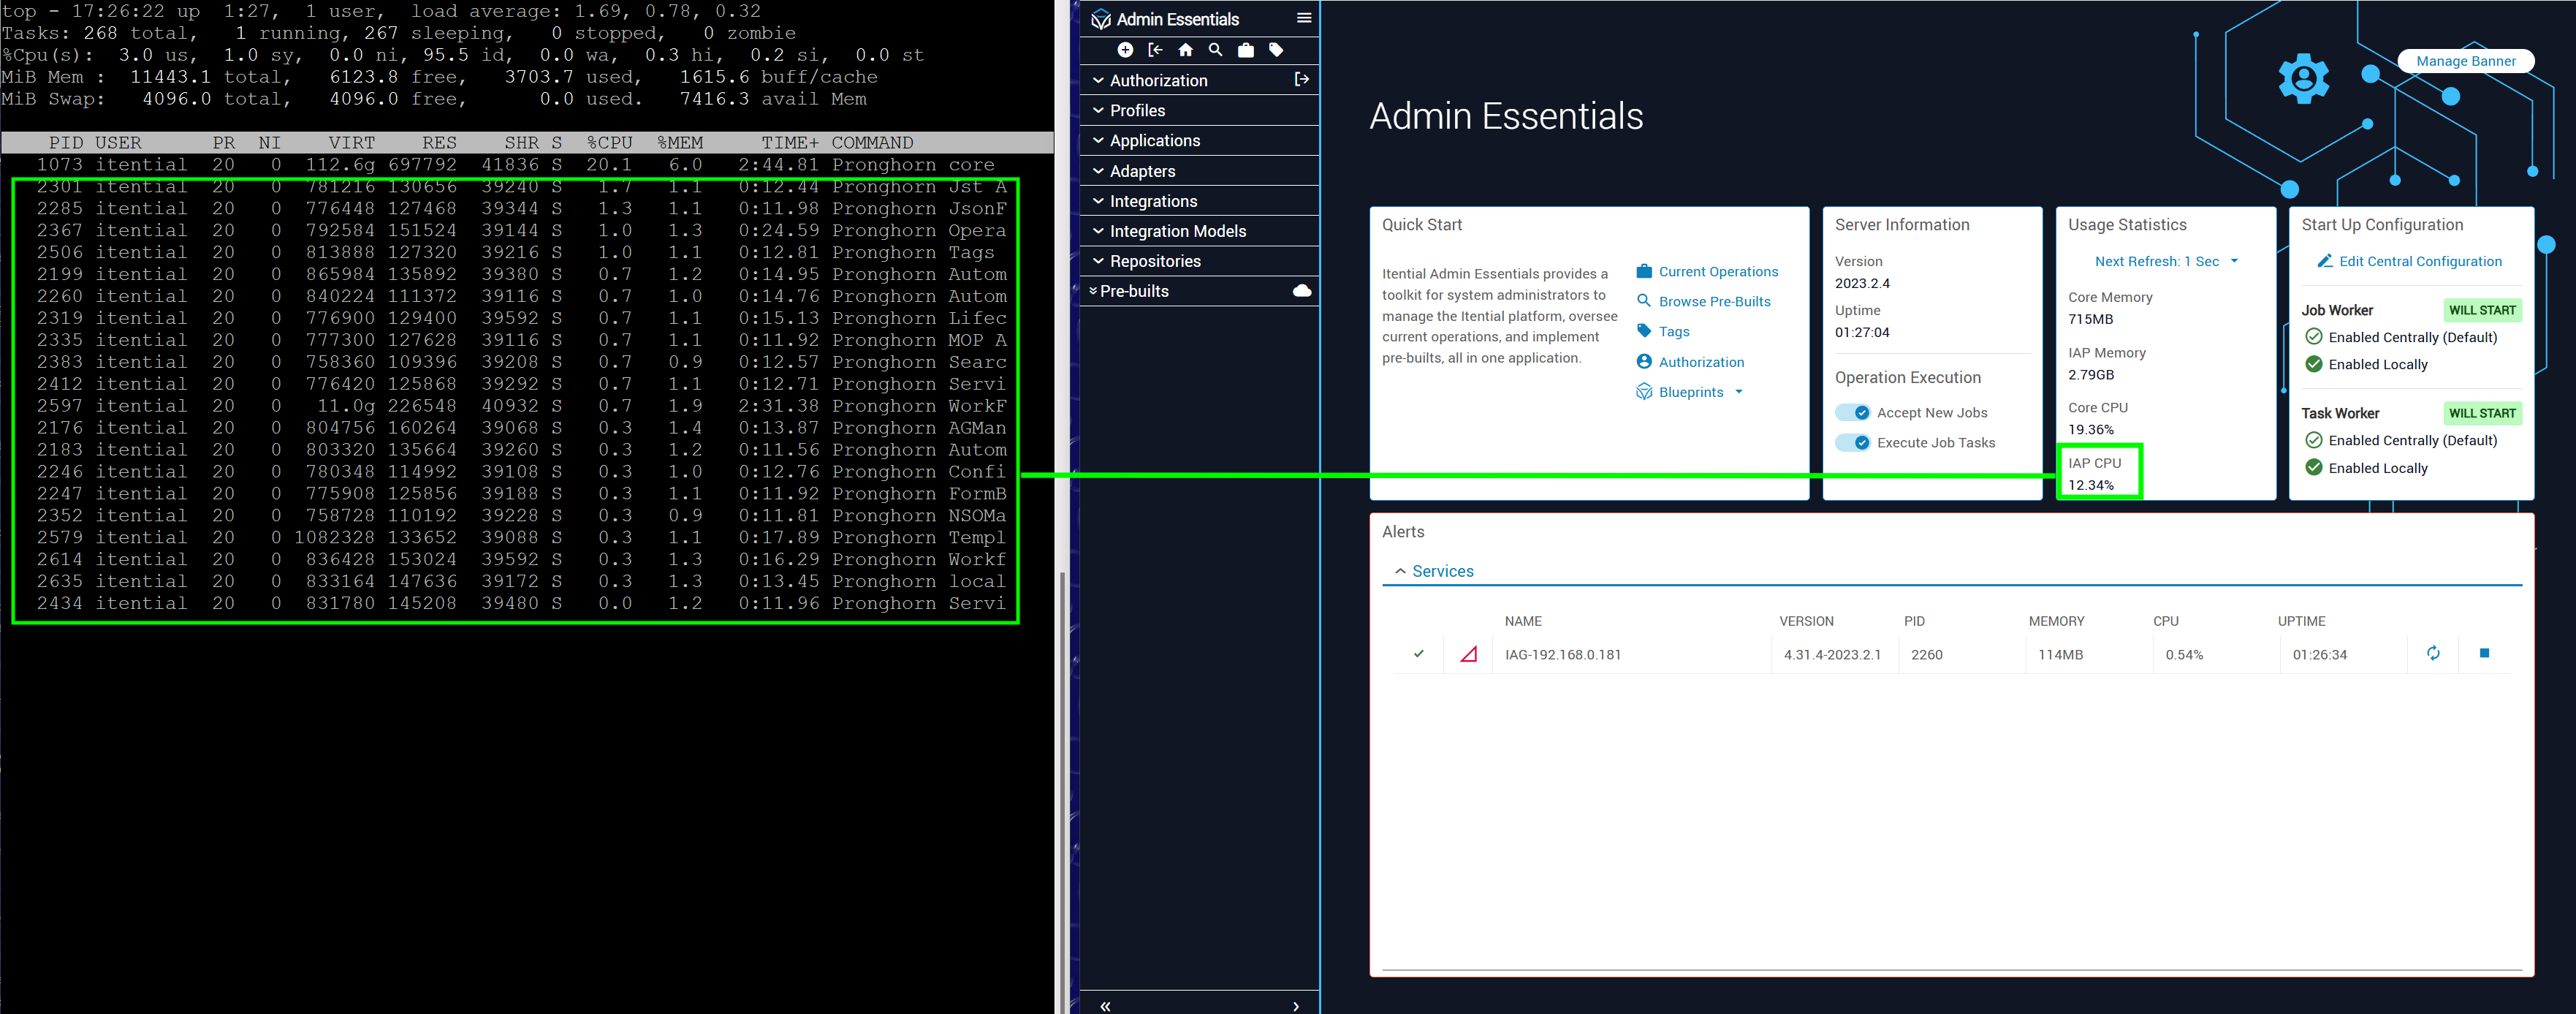
Using the top command to analyze activity and performance
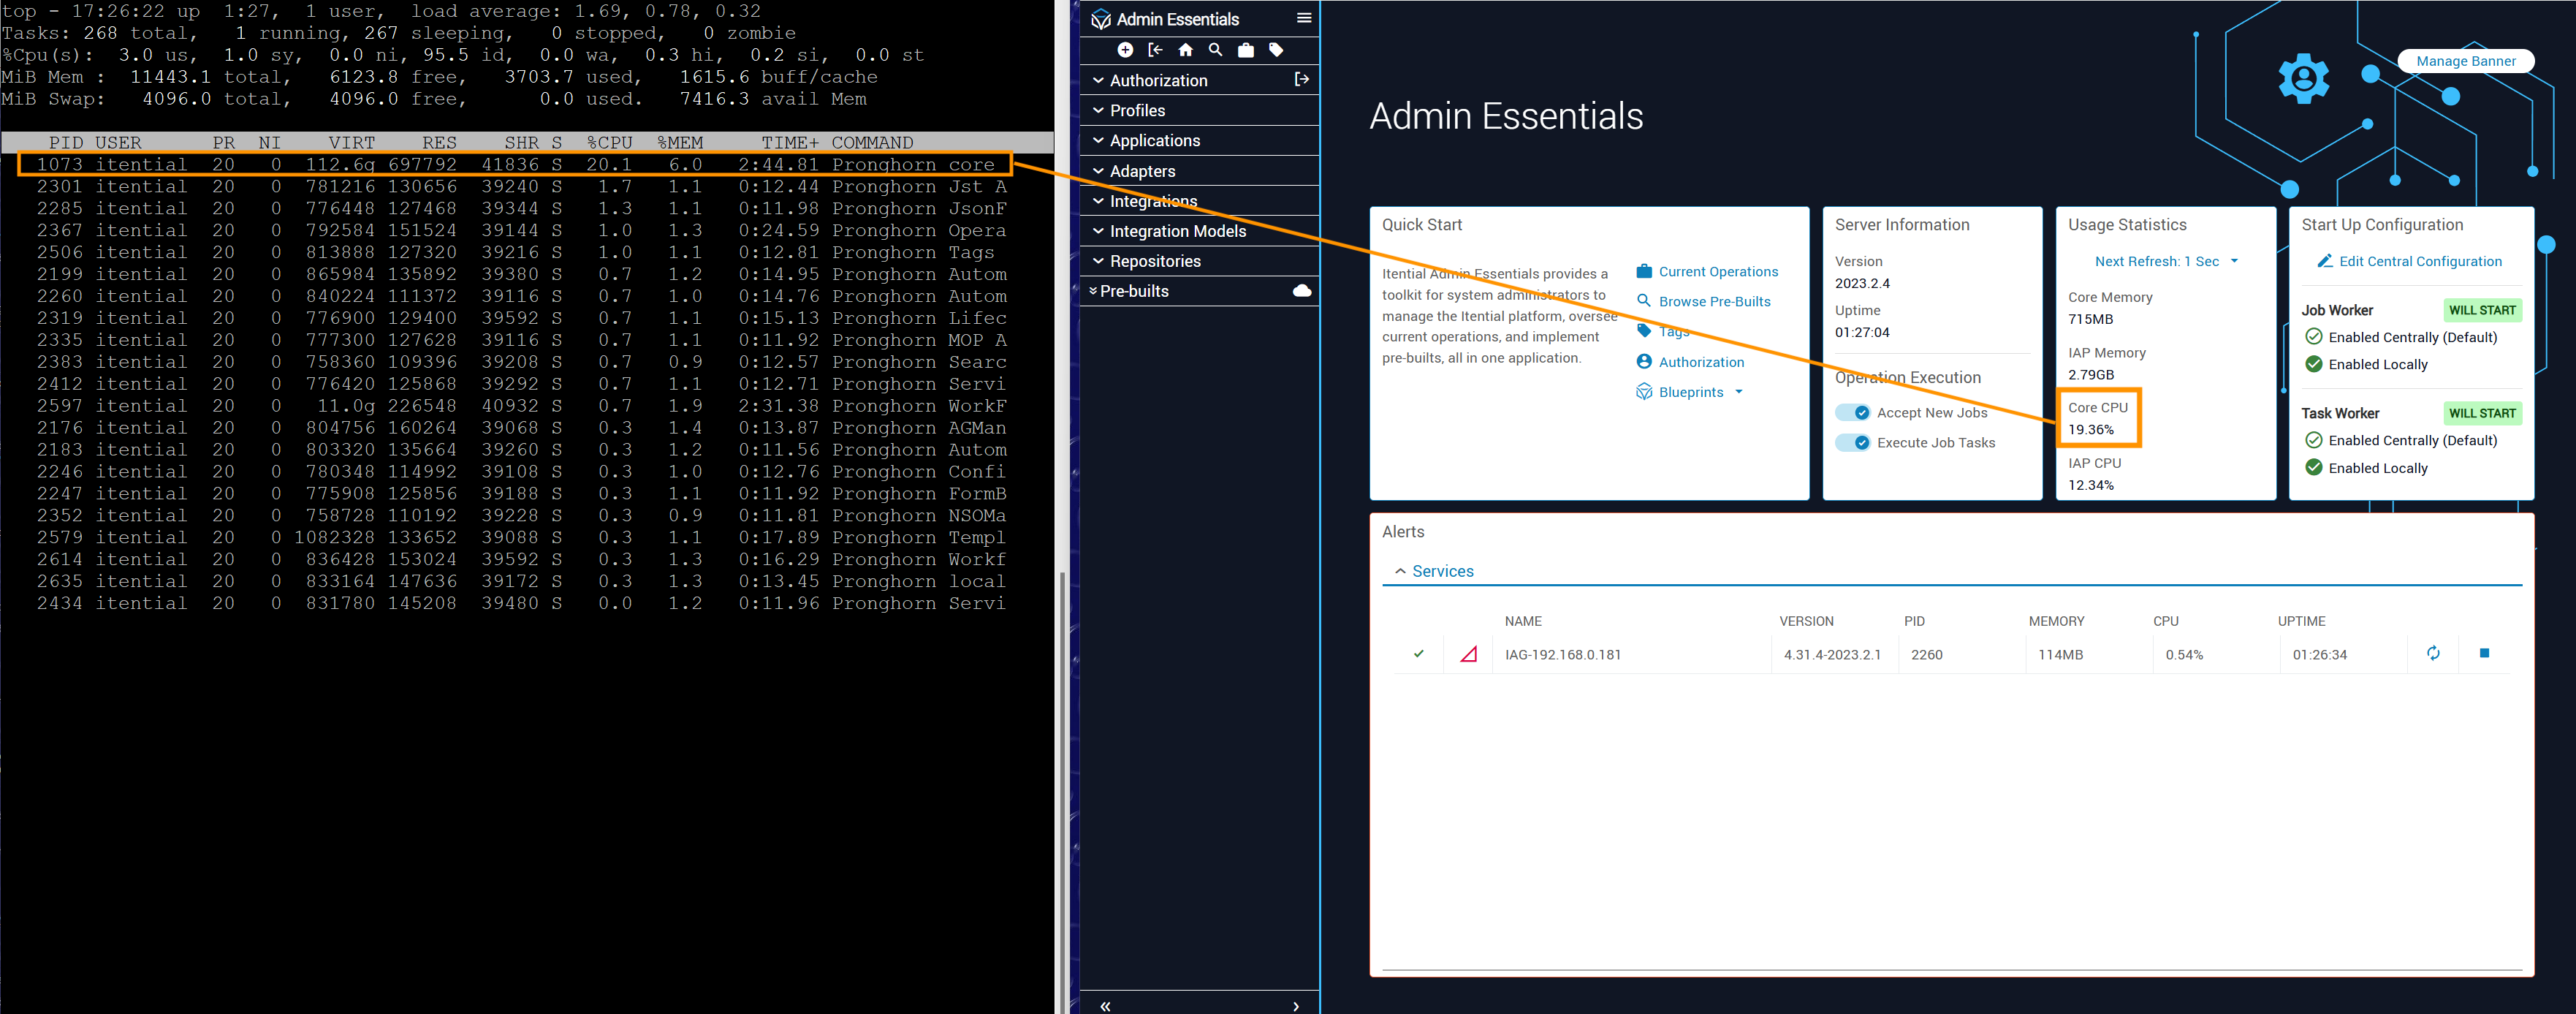
To help identify processes that are consuming a lot of resources, use the top (table of processes) command to show running processes in the Platform, including CPU and memory usage.
Prerequisites: A system running Linux, access to a terminal window, and administrator sudo privileges.
Multiple processors spread across multiple processes (apps, adapters, etc.) within the Itential system can yield a percentage that equals or exceeds 100%. Having too many processes or apps running at once can strain CPU resources.
Related reading: Prometheus Metrics
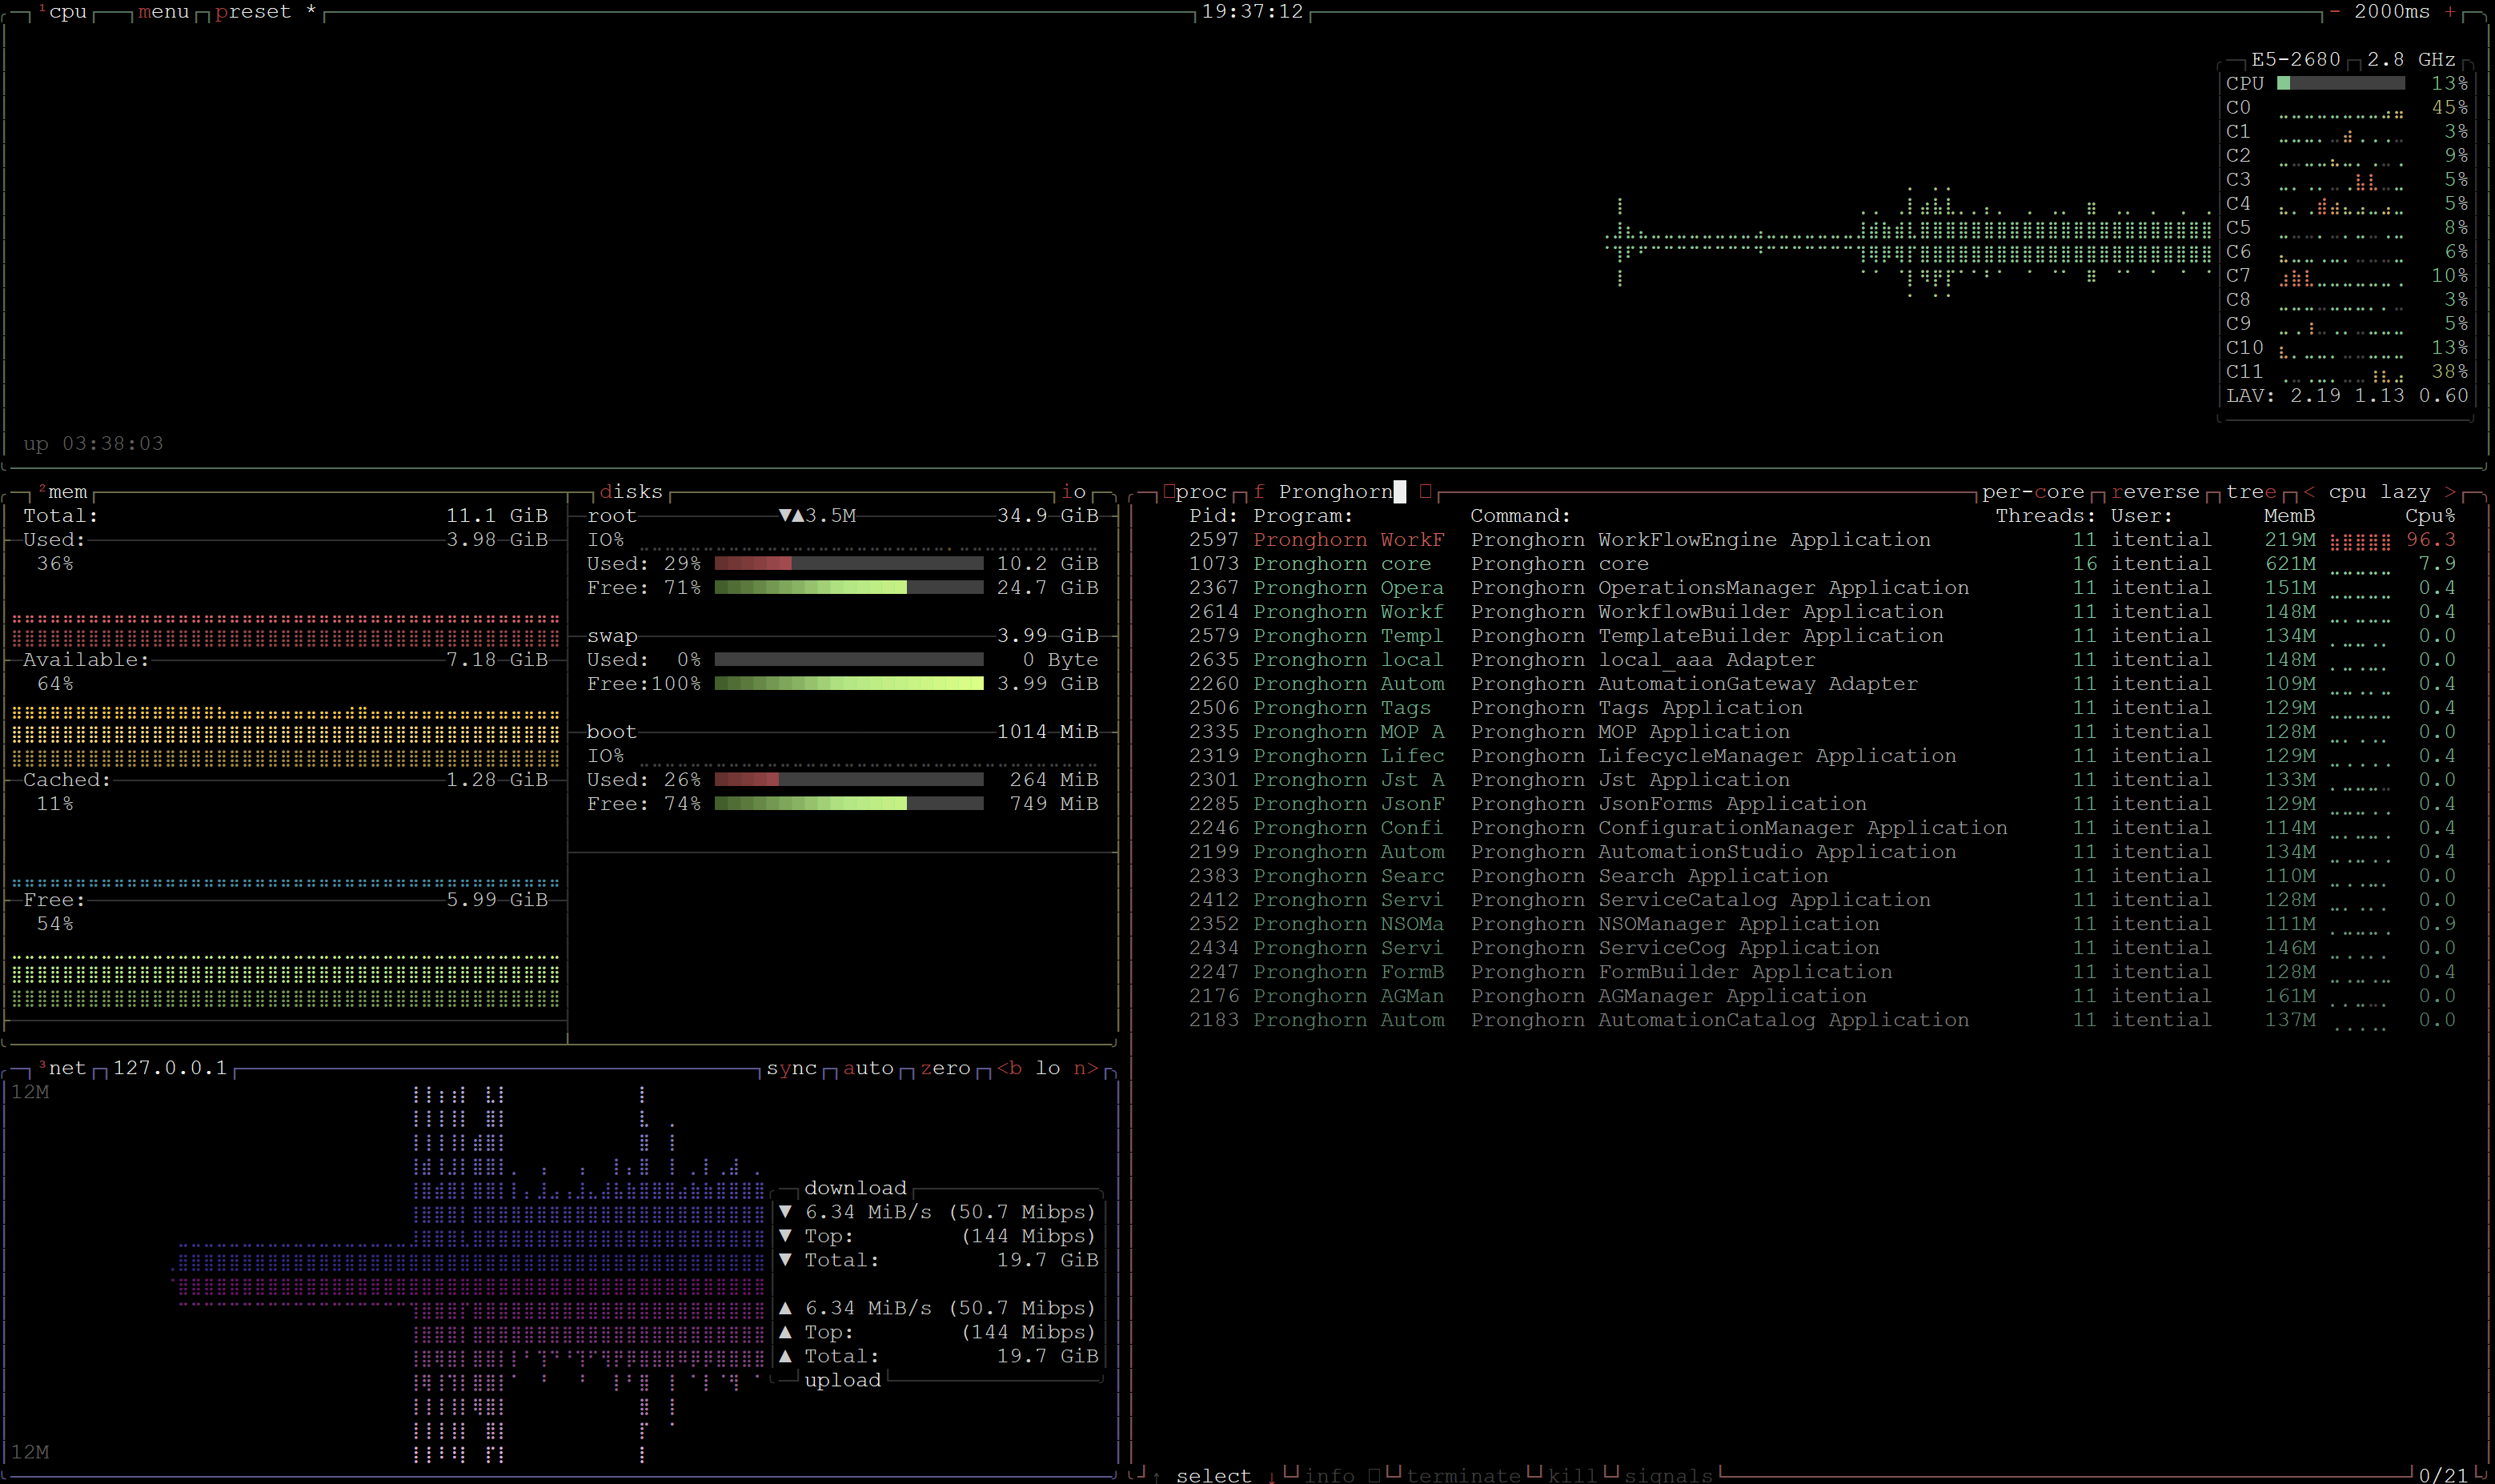
Using the btop command
For a more detailed view into system resources and as an alternative to the standard top command, use btop to show usage for processor, memory, disks, network, and processes. From the btop interface, you can also sort and filter by different metrics and send signals to processes (e.g., SIGTERM, SIGKILL, SIGINT).
For more information on how to use btop, refer to the btop online documentation.
Manage message banners
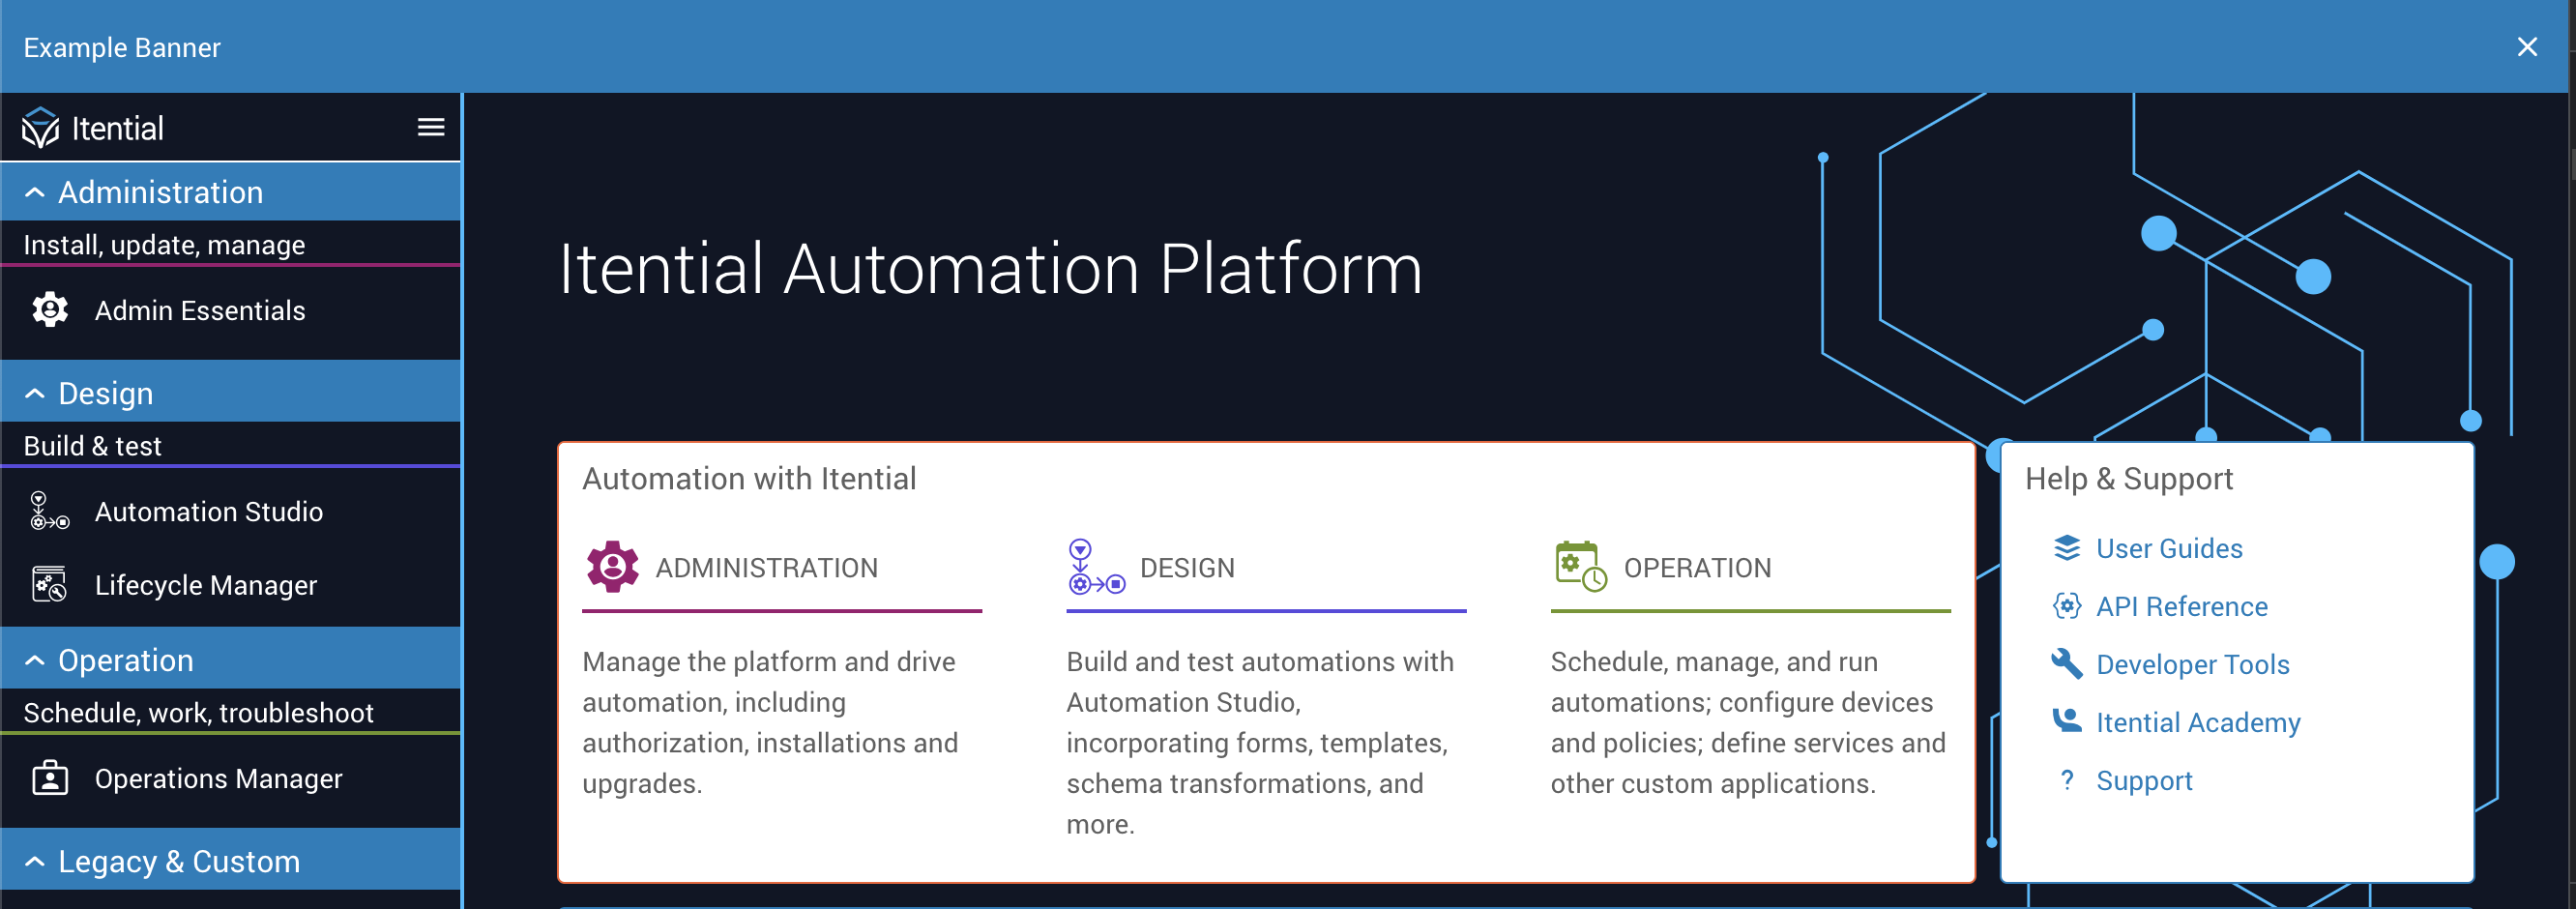
Message banners are system-wide banners that display on specified pages within the Itential application. The banner feature can be useful for alerting users about upcoming maintenance release windows, software version upgrades, scheduled downtime, or requiring users to acknowledge an announcement before they can proceed. Only a single global banner is supported, and users can dismiss the banner when that option is enabled in the admin settings.
Banners are apparent from their background color and placement. The example below shows a banner placed on the home page (at the top) after the initial user login. Admins can set the background color, font type, and size. Font color is auto-adjusted to contrast with the background color to maintain visual accessibility.
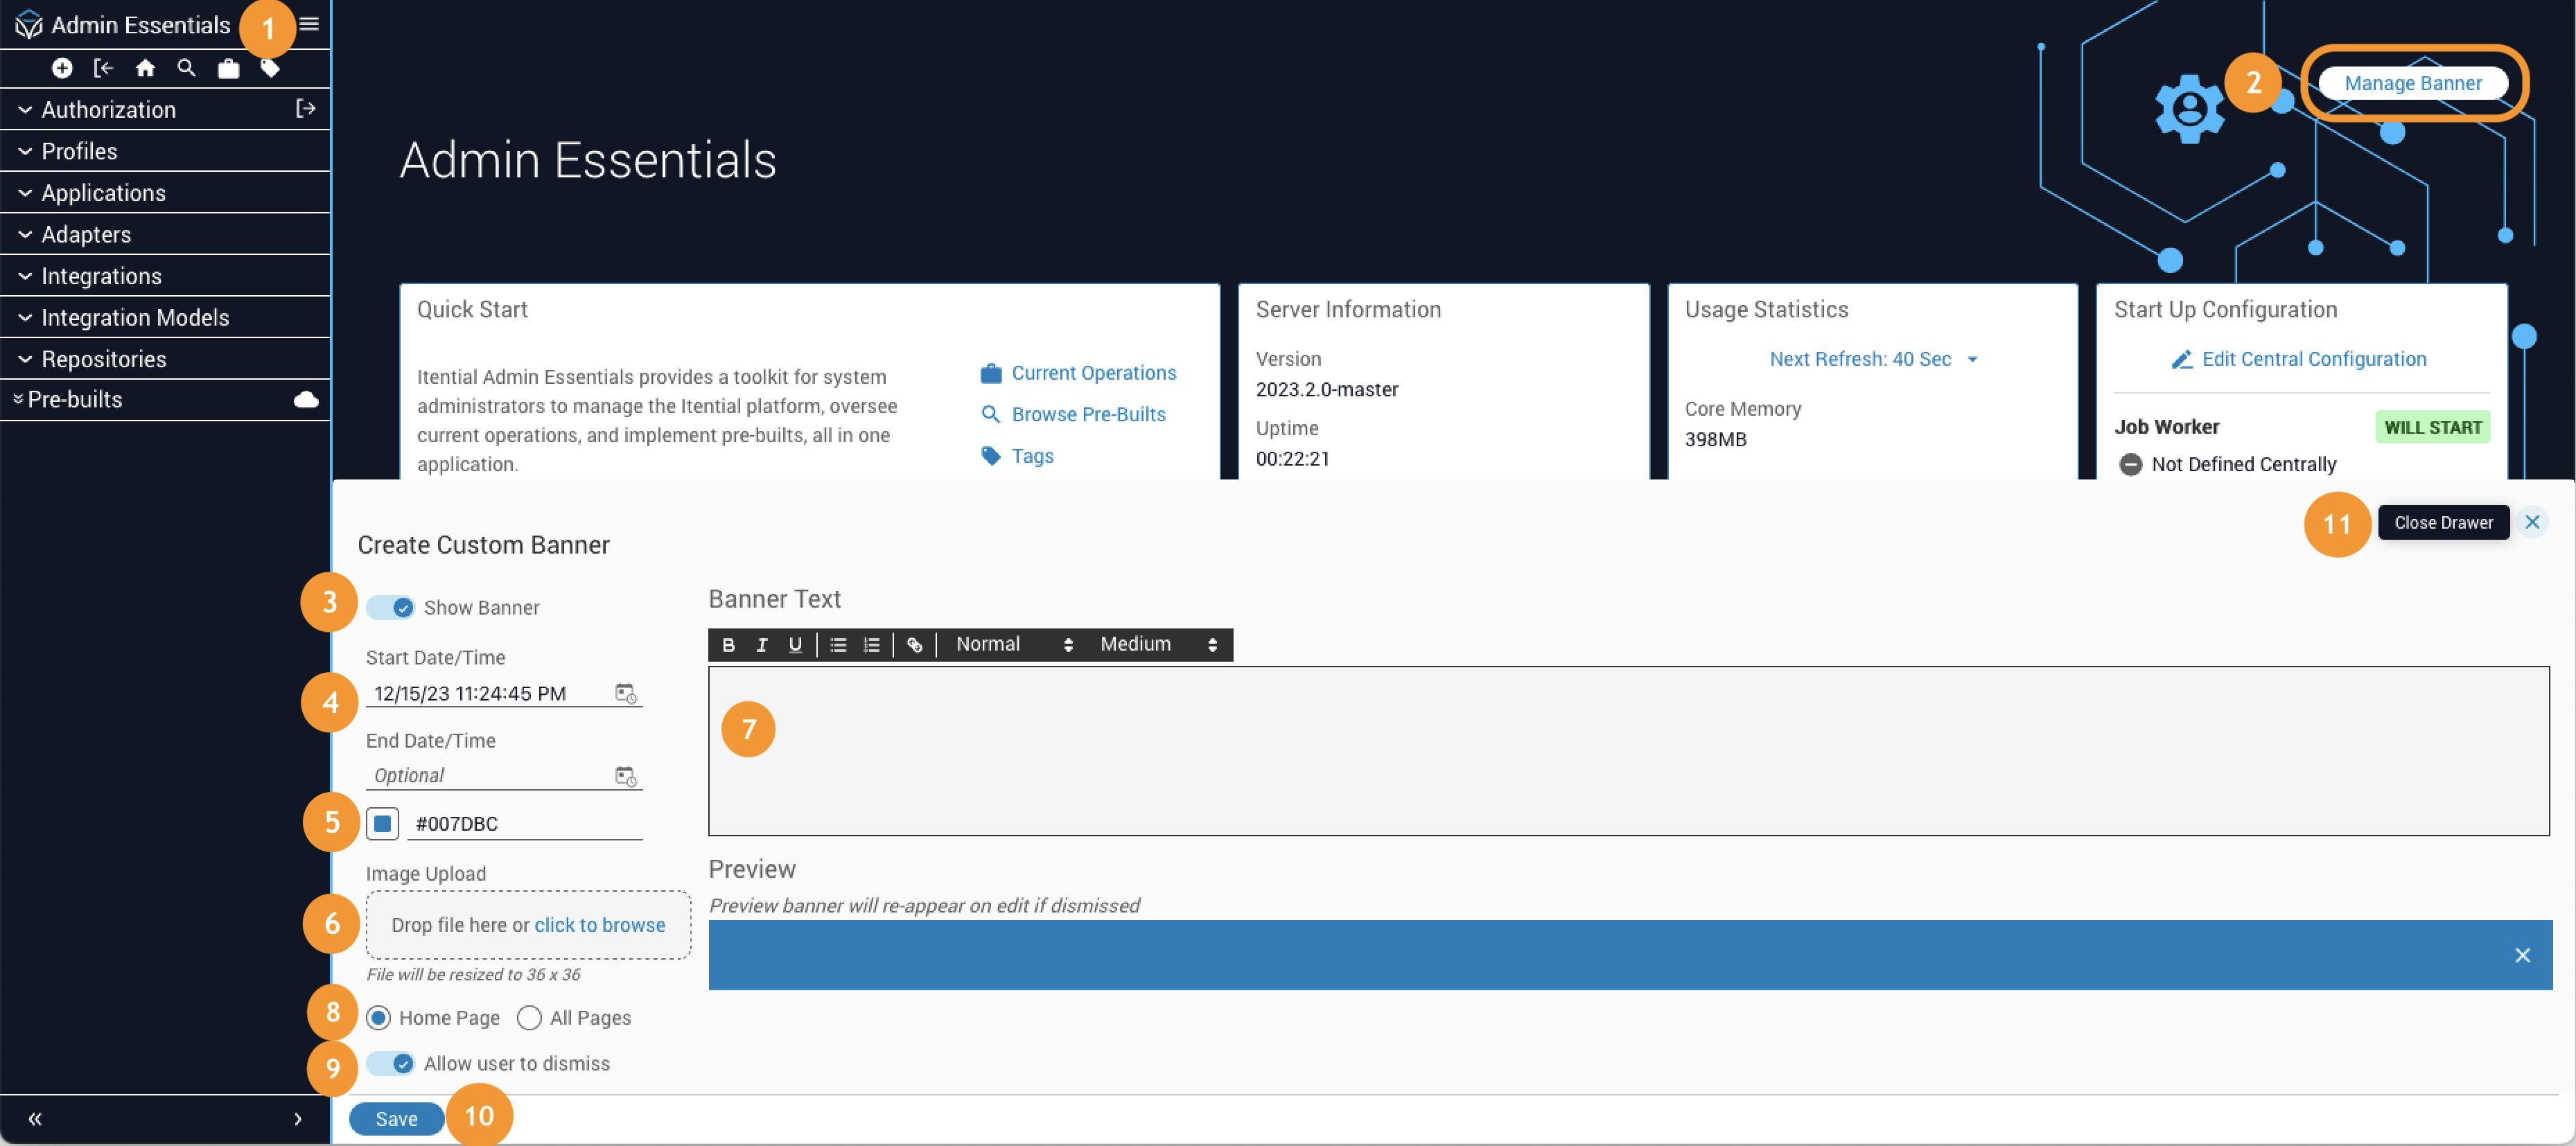
Create a message banner
Open the banner dialog
Log in to your Itential Platform instance, navigate to Admin Essentials, and click the Manage Banner button (upper-right corner). The “Create Custom Banner” dialog displays.
Set run dates
Use the time controls to enter your desired run dates for the banner. You can enter the date directly or use the calendar icon for selection. Set a “Start Date/Time” (when the banner should first appear) and an “End Date/Time” (when the banner should no longer appear).
Set background color
Use the style control to set a background color for the banner. You can enter the Hex Color Value directly to change the background color. The default color is Blue (Hex #007DBC).
Add an image (optional)
Use Image Upload to embed an image (e.g., a custom logo) that displays in the banner. To fit within the banner, the image file (ICO, PNG, JPG, SVG) is resized to 36×36 pixels.
Enter message text
Enter your message text for the banner in the Message Editor. A preview of the message appears below the editor.
Select display pages
Select the “Home Page” or “All Pages” option to specify where the banner displays.
Message Banner Editor
The Message Editor is a WYSIWYG editor — what you write will look the same as what appears on the displayed page. It uses Rich Text formatting and includes a formatting toolbar with five categories of options (from left to right): Text Formatting, Paragraph Formatting, Insert URL Link, Font Style, and Font Type.
Text formatting options include Bold, Italic, and Underline.
Paragraph formatting options include Unordered list (bulleted) and Ordered list (numbered).
Insert Hyperlink allows you to add an absolute URL to generate a hyperlink to additional information such as reference articles, product documentation, or release notes.
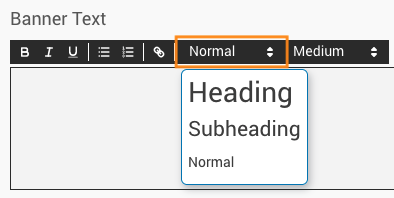
Text style options include Heading (first level), Subheading (second level), and Normal text.
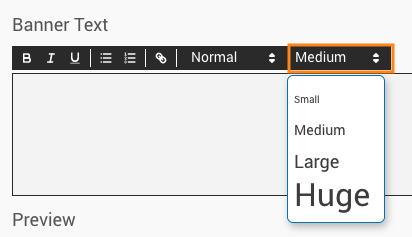
Font size options include Small, Medium, Large, and Huge.
Troubleshoot message banners
If your banner does not appear, check your permissions. In some instances, you might need to adjust the permissions on the banner-schema Customization API routes.
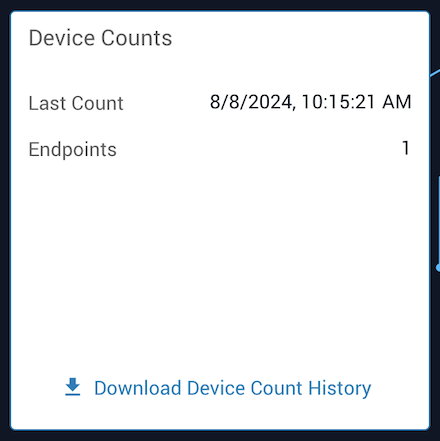
Device Counts
Platform 6 includes the ability to capture the number of “devices” (adapter endpoints) connected to the platform. This functionality is orchestrated through the getDeviceCount() API, with access to device count information available through a downloadable CSV file. The CSV file provides a historical device count record specific to each adapter endpoint, along with a date/timestamp reflecting when the polling was done.
One year (365 days) of device count data history is retained.
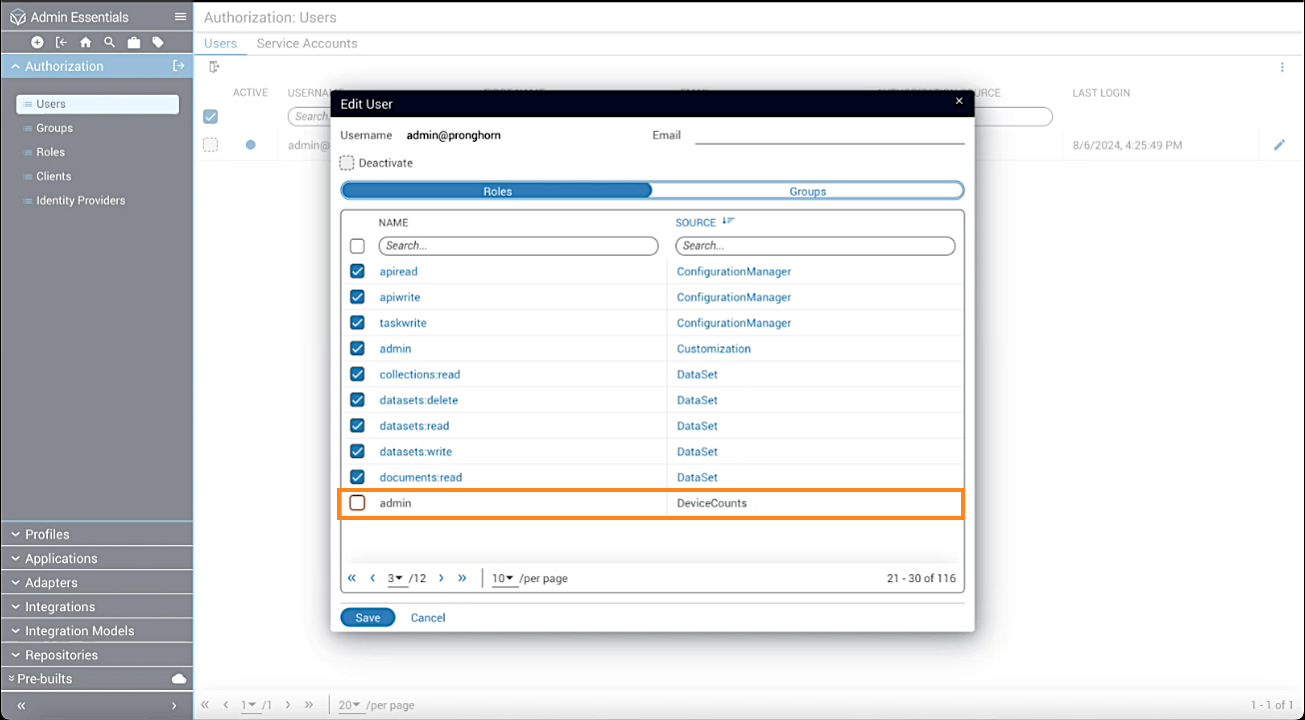
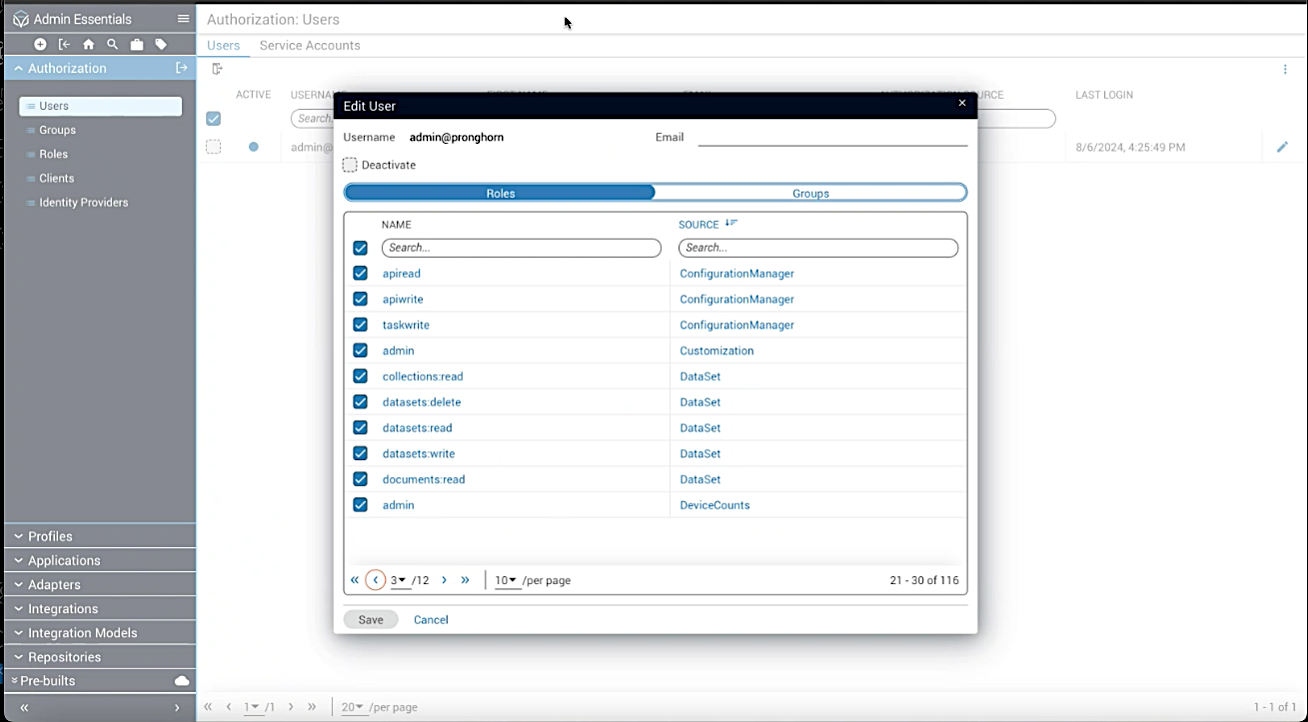
Assigning device count role permissions
Role-based access for device count data is set through Admin Essentials. To utilize this feature, you must have assigned permissions to read/write roles on user and group entities, and must have assigned permissions to perform the download.
Log in as administrator
Log in to Itential Platform as an administrator (a user with the pronghorn.admin role).
Download device count data
Device Count CSV file
Device Count information headers in the CSV file follow this format:
<serverId>,<adapter-name>,<date>,<time>,<count>
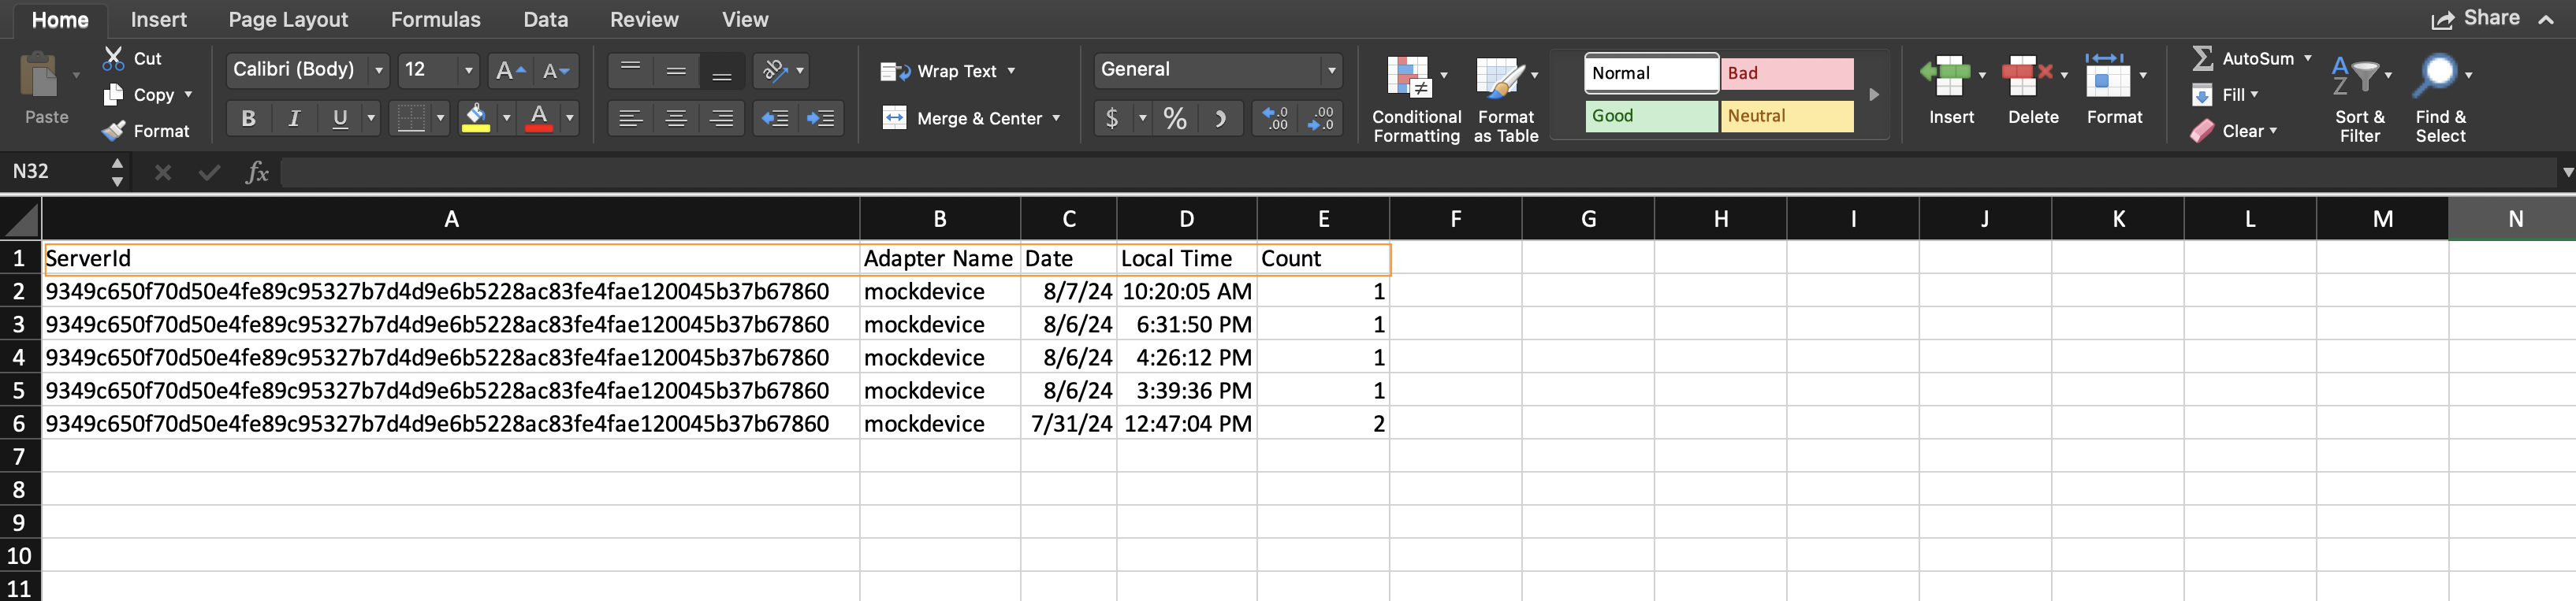
Each row of information is specific to an adapter, and the date/time reflects when the polling was run. You can sort and filter device count data by timestamp, from oldest to newest, or by date ranges.
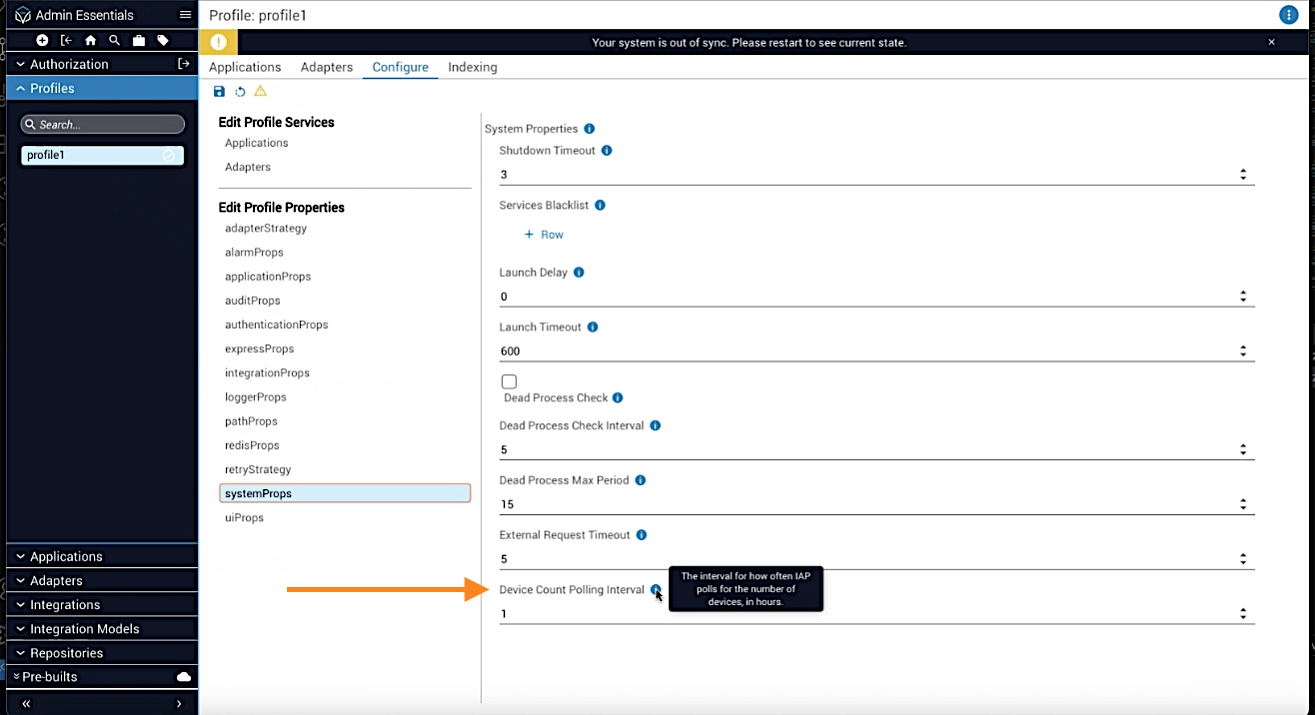
Device Count polling interval
From the active profile of Admin Essentials, you can configure the Device Count Polling Interval to set how often Itential Platform polls for a device count.