View web server access logs
This guide explains how to use a web server access log to see the calls made to the web server within Itential Platform.
You will need to access the Profile application within Admin Essentials. Navigate to Itential Platform > Admin Essentials > Profile. For more information, see Profiles.
Common log format
The log format for the web server access log is a stringified JSON object with each key mapping to a part of the Common Log Format. Since this is a JSON format, the ordering of the keys is not guaranteed. The keys, in the order they appear in a traditional Common Log Format, are referenced below.
Configuration
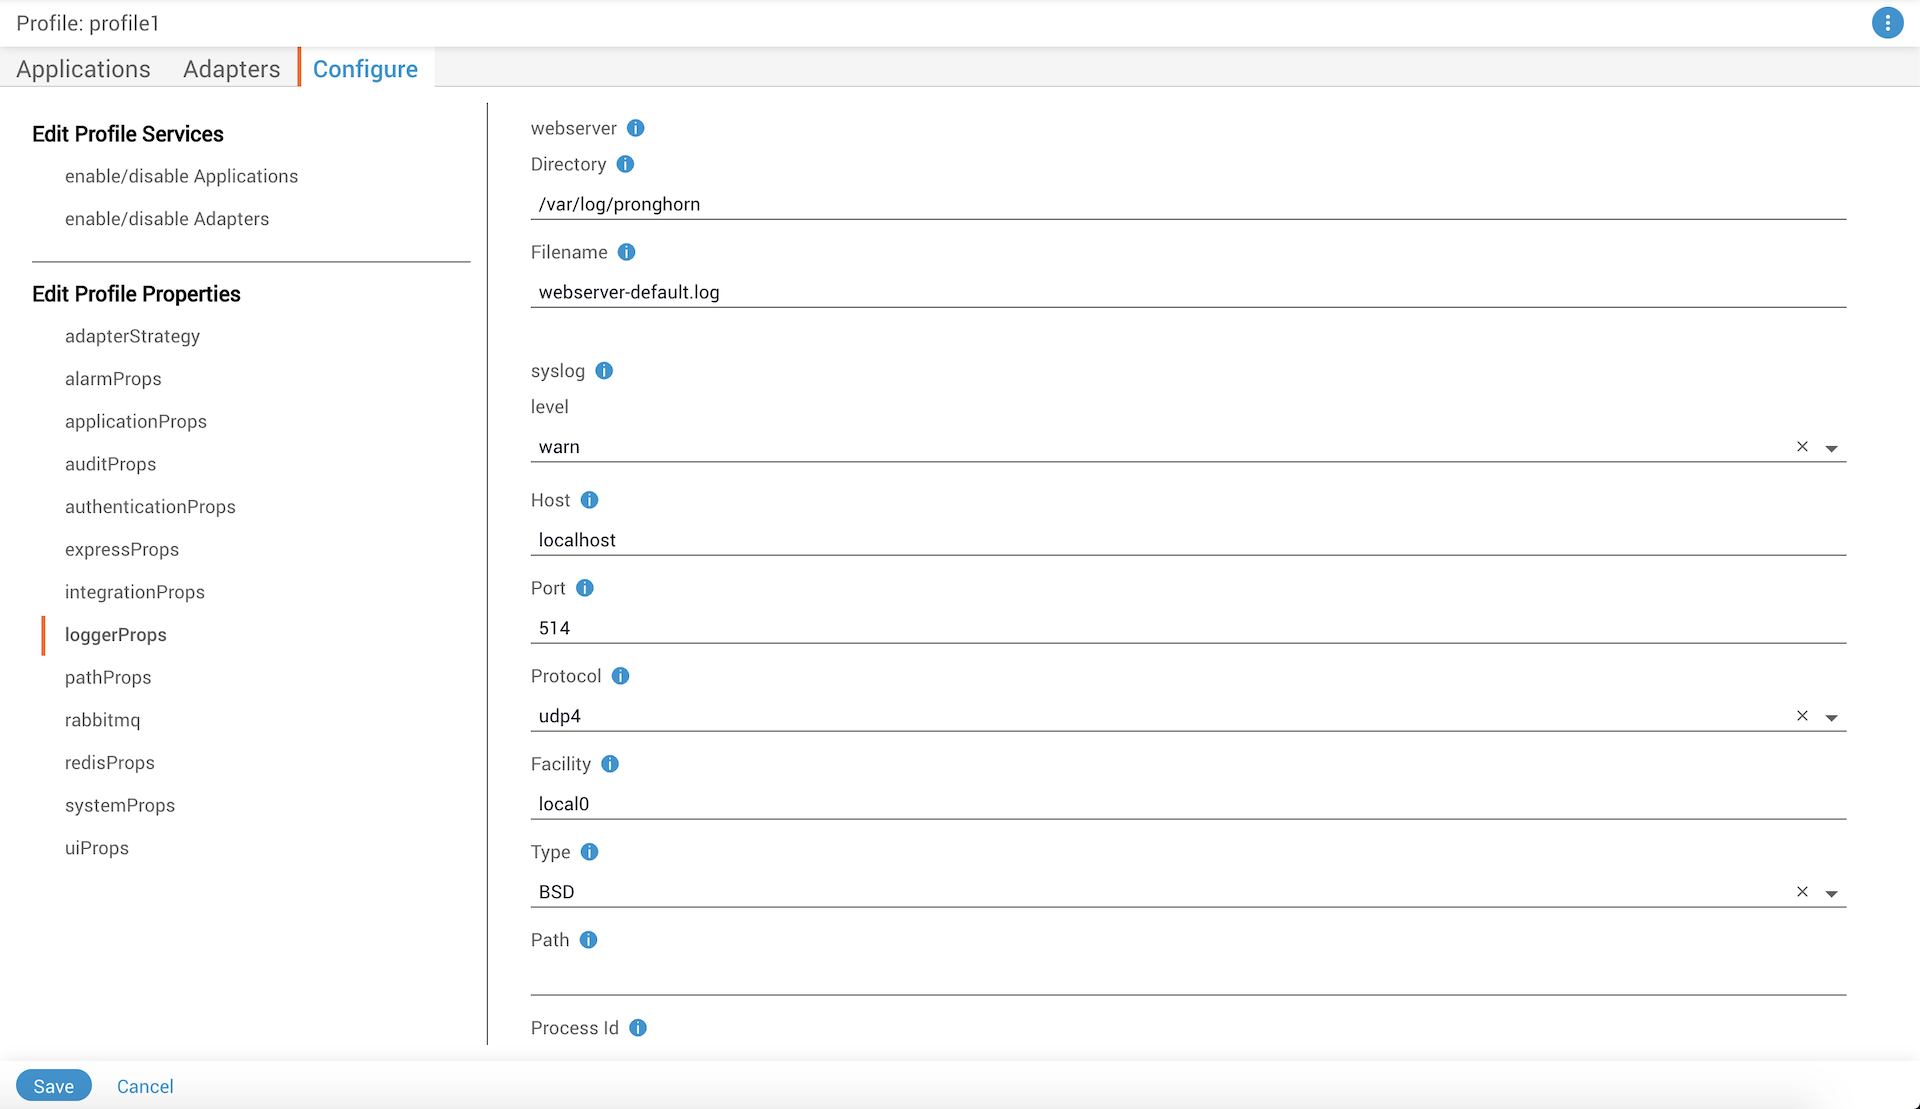
The web server access log currently has two different configurable properties that can be edited within the Itential Platform profile by updating loggerProps in the Profile Properties. Both properties can be found in the webserver section of the Configure tab.
Log rotation
There is no automatic log rotation built into the web server access log, which makes configuring an external log rotator very important. One useful tool to accomplish this is logrotate, a Linux tool that can automatically rotate a log file based on configured parameters.
Install logrotate
Install logrotate using your package manager:
RHEL/CentOS:
Configure logrotate
Verify that logrotate is installed, then check the configuration file at /etc/logrotate.conf. There may be other ways to handle configuration, such as inside the /etc/logrotate.d/ folder.
Example configuration by size
The following example shows a configuration where the webserver logfile is named webserver.log and is located at /var/log/pronghorn:
In this example:
- Logs rotate a maximum of 10 times before old log files are deleted
- Logs only rotate when their size exceeds 10 megabytes
- Files are not compressed when rotated
Example configuration by time
Another possible configuration:
In this example:
- Logs rotate weekly instead of by size
- Logs rotate a maximum of 20 times
- A postrotate script runs after each rotation (in this case, echoing “Hello World” to the console)
Run logrotate
Start the log rotation:
To force a rotation immediately, even when conditions like file size have not been met:
Query log files
The log files can be queried using basic command line tools such as grep to search the file for a given pattern.
Use grep or similar command line tools
To find any API requests made by a user named admin for the log file named webserver.log:
To retrieve all times a user has made a request to a specific route, such as GET /health/system:
There are many other ways grep and similar command line tools can be used to query information from the JSON logs. Since all data values are preceded by a key, such as url or remote_user, it is possible to do standard queries on any value.
Use third-party visualization tools
The log format used by the access log should work with various third-party tools which support a standard JSON log format. These can be used for more advanced queries or visualization of logging information.